WebProNews

Tag: Reports

  • Online Ad Revenues Reach Historic High

    The Interactive Advertising Bureau (IAB) has released a report on Internet ad revenues, which the organization says climbed to an all-time high of $17 billion in the first half of 2012. This is, in fact, a 14% year-over-year increase (compared to the previous high of $14.9 billion in the first half of 2011).

    The second quarter alone also saw a 14% year-over-year increase, hitting $8.7 billion (up from $7.7 billion during the same period last year).

    Here’s a look at the yearly increases for the first half of the year since 1996:

    First Half ad revenues

    “This report establishes that marketers increasingly embrace mobile and digital video, as well as the entire panoply of interactive platforms, to reach consumers in innovative and creative ways,” said IAB President and CEO Randall Rothenberg. “These half-year figures come on the heels of a study from Harvard Business School researchers that points to the ad-supported internet ecosystem as a critical driver of the U.S. economy. Clearly, the digital marketing industry is on a positive trajectory that will propel the entire American business landscape forward.”

    IAB SVP, Research, Analytics and Measurement, Sherrill Mane, added, “Solid double-digit growth in a stagnating economy is a significant accomplishment. There is evidence that CPMs are maintaining, and even increasing, further substantiating the vitality of the internet ad market.”

    Mobile nearly doubled year-over-year for the first half of the year, rising 95% to $1.2 billion, compared to $636 million from the same period last year. Digital video increased 18% year-over-year, reaching over $1 billion in revenue (up from $900 million from the same period last year).

    “The tremendous growth of mobile advertising revenue over the past year is an indication of the importance of location to advertisers and mobility to consumers,” said David Silverman, a partner at PwC US, which prepared the report for the IAB. “Bringing the power of the internet to mobile devices has opened up a world of possibilities to both consumers and marketers.”

    Search revenues totaled $8.1 billion, up 19% from $6.8 billion. Display revenues hit $5.6 billion, up 4% from $5.3 billion in the same period last year, and accounting for 33% of the first half of the year’s ad revenues.

    You can find the full report here.

  • Yahoo Bing Network CTRs, CPCs Consistently Higher Than Google [Report]

    Kenshoo has released a new report looking at global search advertising trends. While paid search budgets have been significantly higher year-over-year for all three of the year’s first quarters, the firm says there was not a lot of fluctuation in ad spend quarter-over-quarter (which is pretty much how it went in 2011).

    “Last year, there was a large ramp-up in Q3 but this year, advertisers increased their budgets early and consistently throughout the year,” Kenshoo says.

    Quarterly search ad spend

    According to the report, global paid search average CPCs rose in both Q2 and Q3, following four consecutive quarters of falling rates. They’ve risen to $0.46 after bottoming out at $0.40 in Q1. They were at $0.47 during Q3 of 2011.

    Total search ad impression volume fell for its second consecutive quarter in Q3 2012, Kenshoo says. It’s down 23% overall since Q1.

    In the U.S., the Yahoo Bing Network average CTR and CPC is consistently higher than Google, according to the report. Kenshoo says:

    Over the past 6 quarters, the Yahoo! Bing Network (YBN) has delivered sequential increases in search ad CTR in every quarter except Q1 2012, in which CTR was flat QoQ. Meanwhile, Google AdWords CTR has oscillated, hovering near 1% with a significant uptick to 1.25% in Q3 2012. 6 quarters ago, the gap between YBN and Google CTR was miniscule. Today YBN CTR is 29% higher than Google. Similarly, the 2 engines were very close in CPC back in Q2 of 2011 but now there is a considerable gap with YBN CPC 46% higher than Google. During that time, YBN CPC increased significantly from Q2 to Q3 2011 and then remained relatively flat, while Google CPC has come down from an 18-month high of $0.61 to $0.45 in Q3 2012.

    Yahoo Bing Network performance

    According to the firm, paid search budgets are growing faster for Yahoo/Bing than for Google. In Q3, Yahoo Bing Network ad spend was up 10% quarter-over-quarter and 35% year-over-year. Google was up 75% quarter-over-quarter and 28% year-over-year. As far as clicks, Yahoo Bing Network grew faster quarter-over-quarter but Google grew faster year-over-year.

    The full report is available here.

  • Obesity Rates Prediction: U.S. Will Get Even Fatter

    A report released today predicts that by the year 2030, 13 U.S. states could have obesity rates above 60% and 39 could have rates above 50%.

    The report, titled F as in Fat: How Obesity Threatens America’s Future 2012, was released by the Trust for America’s Health (TFAH) and the Robert Wood Johnson Foundation (RWJF). The TFAH is a non-profit organization dedicated to protecting citizens’ health and preventing disease. The RWJF is a philanthropic organization dedicated to public health.

    According to the report, all 50 states could have obesity rates above 44% by 2030. A CDC report released last month indicates that the current fattest state in America, Mississippi, has an obesity rate of 35%. In the report released today, it is predicted that a full two-thirds (66.7%) of Mississippians could be obese by 2030.

    “This study shows us two futures for America’s health,” said Dr. Risa Lavizzo-Mourey, RWJF CEO. “At every level of government, we must pursue policies that preserve health, prevent disease and reduce health care costs. Nothing less is acceptable.”

    As a consequence of the predicted weight gains, the report also anticipates huge rises in the medical costs associated with obesity. It predicts that in 2030 medical costs due to obesity-related diseases could increase $48 billion to $66 billion per year in the U.S., up from the $147 billion to $210 billion the report estimates it already costs the U.S. today. It also estimates that loss-of-productivity costs due to obesity could rise to $390 billion to $580 billion yearly.

    “We know a lot more about how to prevent obesity than we did 10 years ago,” said Jeff Levi, executive director of TFAH. “This report outlines how policies like increasing physical activity time in schools and making fresh fruits and vegetables more affordable can help make healthier choices easier. Small changes can add up to a big difference. Policy changes can help make healthier choices easier for Americans in their daily lives.”

    In addition to more physical activity, fruit, and vegetables, the report also recommends that public policy be implemented to curb the rise in obesity. It suggests updating nutrition standards for snack food and beverages in schools and raising school meal standards by implementing the Healthy, Hunger-Free Kids Act . It also recommends investing in evidence-based obesity-prevention programs, making physical activity a priority for Elementary and Secondary education, and implementing other legislation related to nutrition, public health, and marketing food to children.

    The report based its projections on a model published in The Lancet in 2011, using data from the CDC. Adults are currently considered obese if their body mass index (BMI) is 30 or higher.

  • Verizon Data Breach Report Available as a Free iBook

    Verizon’s 2012 Data Breach Investigations Report was released as a PDF back in March, but now those interested in the world of digital espionage can kick back and read the report on their iPad, as Verizon is releasing the entire report as an iBook. The report revealed that Anonymous “hacktivism,” is on the rise worldwide. “Hacktivism” is generally understood to be system security breaches by individuals or groups motivated by political disagreement or protest.

    The iBook is only available in English, but Verizon states that the iBook format is more easily digestible than the PDF. Charts and graphs in the report have been placed closer to their reference text and they can now be interacted with for a zoom-view. Users can also now search through the text more easily to find specific topics.

    “Earlier this month, we announced that the full ‘2012 Data Breach Investigations Report’ is available for the first time in six additional languages, and now we are delivering an iBook version to meet the overwhelming interest in the report from the business and security communities,” said Wade Baker, director of risk intelligence for Verizon. “Today users have multiple ways of getting to our data and using it to make better informed security decisions as well as to bolster their security defenses.”

    This year’s report is Verizon’s fifth annual Data Breach Investigations Report. It includes analysis by the Verizon Research Investigations Solutions Knowledge (RISK) team of 855 data breaches and over 174 million compromised records. The report can be downloaded now in the Apple App Store or through iTunes.

  • Google Report Shows Popularity Of Different Ad Units

    Google released a new report called “Display Business Trends: Publisher Edition,” which looks at aggregated global data across its display ad solutions, including: the DoubleClick Ad Exchange, DoubleClick for Publishers, and the AdSense network.

    “The goal is not to give a snapshot of our business, but rather to provide some insights into the overall publisher landscape that we hope publishers (and the general industry) find valuable,” a Google spokesperson tells WebProNews.

    Google says it’s releasing the report (which is the first in a series) to generate metrics that will answer some common questions the company gets from its partners, as well as to “put some data behind long-held industry assumptions.”

    According to the report, the 468×60 banner ad unit dropped down to 3% of all impressions, while “brand-friendly premium” units are gaining share. Google says smaller ad units are dropping in popularity. “However nearly 80% of all impressions are the ad unit “three musketeers”: the medium rectangle, leaderboard, and skyscraper still comprise the vast majority of ads served,” Google Display Advertising Director of Product Management Jonathan Bellack says in a blog post.

    “Of a possible estimated 245 different countries and territories, we saw publisher ad impressions from 235 of them,” says Bellack. “These included the island country of Palau – one of the world’s newest sovereign states – and the middle-African nation of Equatorial Guinea, with astounding growth rates of 1106% and 4635% respectively. And while the United States still accounts for the highest percentage of impressions overall, we’re seeing a significant representation from China and Japan, coming in at 11% and 6% respectively.”

    Impressions by country

    Shopping, Sports, and Auto & Vehicle sites have been the fastest-growing verticals on the Ad Exchange and Adsense, Google says, while 15 out of 25 publisher verticals displayed double-digit growth year-over-year. Mobile web impressions on the Ad Exchange and AdSense increased by 250% from the third to fourth quarter of 2011. Video ad impressions increased by 70% across the DFP Video platform for the same period.

    You can find the whole report here (pdf).

  • Linux Foundation Releases Annual Development Report

    Every year, the Linux Foundation, a non-profit organization dedicated to the growth of the Linux platform, compiles an annual development report that details the Linux kernel development process. The report covers the work completed through the Linux kernel 3.2 release.

    This year’s report contains some interesting revelations about who’s working on the Linux kernel and the number of changes being made to the platform. While the report itself is definitely worth looking over, here are some of the key findings that make up the report.

    Since 2005, the Linux Foundation has been tracking the number of developers and companies that have contributed to the Linux kernel. This past year has seen an incredible number of 7,800 developers from almost 800 companies contributing to the Linux kernel. The report says this is an increase of 1,000 developers and 200 companies from the last report.

    A previous report said that more and more companies are hiring developers proficient in Linux. Those numbers seem to match up with this report that says over 75 percent of Linux developers are paid for their work now. This is because many professional products like Android, cloud computing and Xen are all based off of the Linux kernel.

    Like with every report, the Linux Foundation reveals the top 10 organizations that are sponsoring Linux development. The top 10 organizations this year are Red Hat, Intel, Novell, IMB, Texas Instruments, Broadcom, Nokia, Samsung, Oracle and Google. The big surprise this year in regards to organizations sponsoring Linux development is at number 17 though. Microsoft was revealed as being in top 20, with the software company working with Linux’s collaborative development model to “support its virtualization efforts and its customers.”

    The last major news from the report finds the number of changes coming to the Linux platform is increasing between reports. There is a new kernel release every two to three months and each release sees between 8,000 and 12,000 patches going into it. That’s almost 6 new patches per hour between reports according to the Linux Foundation.

    “Linux is the platform for the future of computing. More developers and companies are contributing to the advancement of the operating system than ever before, especially in the areas of mobile, embedded and cloud computing,” said Amanda McPherson, vice president of marketing and developer services, The Linux Foundation. “The increasing participation represents the power of Linux to quickly adapt to new market opportunities, lower costs, and provide sustained long-term support.”

    You will want to check out the full report here. It contains a break down of all the companies making contributions to the Linux kernel based on number of changes made and number of signoff lines.
    Alongside the release of the report, the Linux Foundation has also made a short video detailing how Linux is built. It’s pretty impressive to see an open source project like Linux take the world by storm. It gives people like me hope that more open source projects can compete with commercialized software.

    [h/t: Geekwire]

  • AT&T Drives the Most Business Traffic in the U.S.

    AT&T Drives the Most Business Traffic in the U.S.

    AT&T is responsible for sending the most Internet traffic to businesses in the United States, according to a new report from comScore, highlighting data from September.

    The report is an analysis of Internet Service Provider market share within businesses in the country. AT&T leads with 20% market share of all browser-based Internet page views.

    Verizon came in second place with 12% share, followed by CenturyLink with 7%. The five largest business ISPs drove about 50% of business Internet traffic.

    traffic by isp

    “The current state of the domestic business ISP market reveals a landscape led by a couple of top providers. However, even with smaller carriers contributing only a fraction of the traffic delivered by top carriers, the business ISP market is still more competitive than the residential ISP market,” said Greg Mishkin, comScore VP of Telecom and Wireless. “The small business segment is even more competitive among ISPs, highlighting the need for providers to develop strong marketing strategies to ensure they can retain and grow market share.”

    Still, AT&T leads the pack across all sizes of business: large, small and medium-sized:

    isps by business size

    The top five ISPs account for nearly 70% of all traffic for large businesses. The percentage goes down, however, the smaller you go. The number is 56% for medium-sized businesses and 40% for small.

  • In a Month, Americans Collectively Spend a Century on Facebook

    Nielsen has just released their Q3 2011 Social Media Report, and there are some incredibly interesting statistics included in the findings.

    On the whole social media (blogs included) is a part of 80% of internet users’ lives. And people aren’t just members of social networking sites, but they are interacting with them…constantly. Apparently, 23% of an American’s time spent on the internet is spent on social media. That’s almost a quarter of the time – more than double the next category of time-occupiers, which is online gaming (9.8%).

    The social media study also looked at the most active social networker and found that to be a woman. This average social media user is between the ages of 18 and 34. She lives in New England, and is likely of Asian or Pacific Island descent. She has most likely obtained a bachelor’s degree and probably makes under $50,000 a year.

    The most mind-blowing stat from the study concerns the amount of time people actually spend on these social sites.  Nielsen looked at minutes spent, collectively, by Americans in one month.  According to the statistics, we spend 53,457,258 minutes, as a population, on Facebook.    That’s almost 102 years.  We don’t even spend a fraction of the amount of time on other sites like Twitter and LinkedIn.

    Here are some other finds from the study –

    • 37% of social media users access the platforms via mobile device
    • As far the most valued services on their mobile devices, people picked social media access as number two, behind GPS
    • Social networking apps are the third most popular apps, behind games and weather
    • Over twice as many people 55 and older used the mobile device to access social media as did last year
    • When you post a video to Facebook, women are more likely to watch but men are more likely to watch longer
    • Social networkers are 47% more likely than other internet users to spend a lot of money on online shopping
    • Australians spend the most time on social networks and blogs
  • Q2 Report: Online Advertising Strong Across All Channels

    Online advertising spend showed a strong second quarter across all channels despite continuing uncertainties from the economy and higher gas prices, according to a new report from IgnitionOne.

    The report is based on a survey of digital media that showed increases in year-over-year spend across paid search, display advertising, and Facebook. Facebook advertising, the firm says, was particularly strong.

    This would somewhat reflect another recent report from MerchantCircle, which found that Facebook ads are gaining popularity among small businesses.

    According to the IgnitionOne survey, Facebook advertising spend is up 22% year-over-year on a same-client-basis, with impressions up 11%.

    Facebook Ads

    “However, Facebook advertising has experienced high rates of growth from new marketer adoption in the past year, contributing a 280% increase in spend across all clients, and 200% increase in impressions YOY,” IgnitionOne tells WebProNews. “Spending patterns within an advertiser’s campaign lifecycle show marked growth declines after the first few months, suggesting advertisers are still in a ‘test and learn’ phase with the new and immature ad platform.”

    Despite the increasing success of Facebook ads, Google was still the “standout performer,” according to the firm. Google showed grew to 80% share of all U.S. search advertising spend in Q2, compared with Yahoo/Bing at 19% share. “Google also saw dominating growth in other key search metrics, including impressions, clicks, CTR and eCPM,” the firm tells us. “Google’s AdEx commands 51% share of U.S. RTB display spend, compared to Yahoo!’s Right Media at 49% share. This marks a significant jump in Google’s market share in display YOY.”

    It will be interesting to see how a jump in market share might impact a pending Department of Justice probe of Google’s pending acquisition of ad-optimization platform AdMeld. The investigation is aimed at determining if Google’s dominance in search advertising could make this an anticompetitive buy, and will examine Google’s plans for expansion strategies related to the acquisition. Google, of course, says that this is not an anti-competitive acquisition.

    “The acquisition is designed to help publishers get the most from the rapidly growing display advertising industry, which is both complicated and incredibly competitive — the emergence in recent years of a huge variety of technologies for publishers, like Admeld’s, is great evidence of that,” a Google spokesperson is quoted as saying. The Federal Trade Commission has since launched its own antitrust investigation into Google’s broader business practices.

    U.S. paid search spend grew a steady 12% year-over-year in Q2, and was flat compared with Q1 growth, according to IgnitionOne. “The quarter began strong, but dipped sharply in June to nearly flat growth on a YOY basis,” the firm says. “While this decline did not have a significant impact on the quarter overall, it could be an indicator of future months’ performance, and expectations for Q3 are cautiously optimistic.”

    Google launched its latest attempt at a social network today. While it is being released under the veil of an early-stages project, it will be interesting to see what impact it might have on Google’s advertising offerings in the months and years ahead.

  • 6 Verticals See Triple-Digit Growth in Mobile Advertising

    Millennial Media has released its latest monthly SMART report, looking at the mobile advertising landscape. The report looks at the top verticals (six of which had triple digit growth YoY).

    The report also looks at actions marketers are trying to get consumer to take when they see the ads. "Social media actions in particular had significant growth quarter-over-quarter, as  marketers are trying to use advertising to drive actions such as ‘liking’ a FB page," a spokesperson for Millennial Media tells WebProNews.

    Some takeaways from the report include:

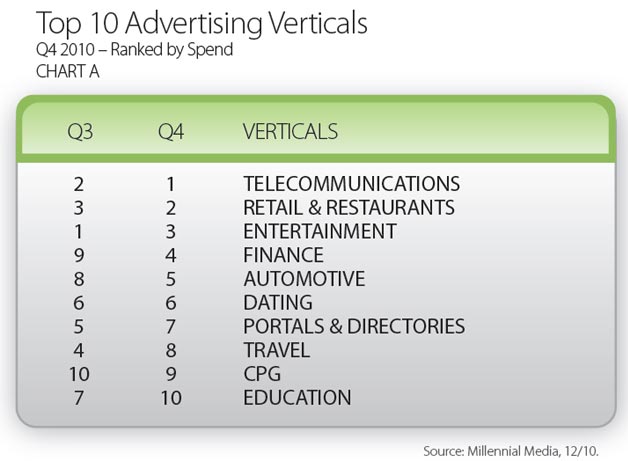
    – Telecommunications was the top vertical for mobile advertising. This was primarily driven by carriers and device manufacturers that doubled down their mobile buys doing the holiday season. Windows Phone 7 devices in particular relied heavily on mobile advertising.

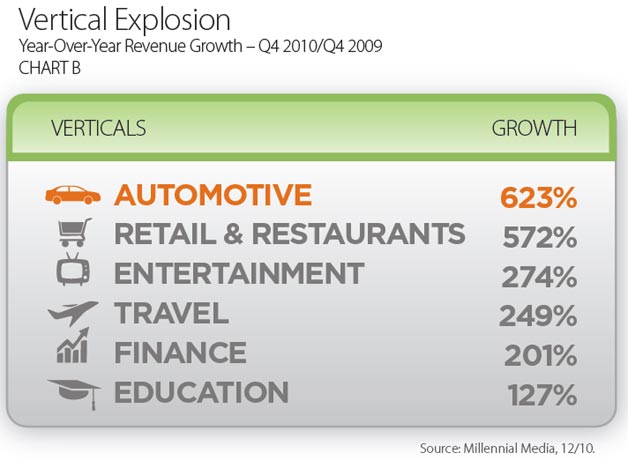
    – Six verticals had triple digit growth year-over-year. Automotive grew 623% and Retail & Restaurants grew 572%

    – 49% of mobile campaigns were designed to drive consumers to a website. 16% of campaigns were designed to drive app downloads

    – Leveraging the increasing consumer desire to use LBS as part of the mobile experience, 22% of campaigns used a "store locator" as the desired campaign action.

    – 14% of campaigns had a "social media" post-click campaign action-where consumers can interact with FB or Twitter, or perhaps post pictures to a custom site

    – 57% of campaigns used a general broad reach, while 43% targeted a specific audience. Of the targeted campaigns, targeting by demographic was the most popular method.

    Top Ad Verticals According to Millennial Media

    Top Ad Verticals According to Millennial Media

    Millennial Media recently reported that Android surpassed iOS as the largest smartphone OS on its network in December. Find the new SMART report here.

  • Android Surpasses iOS For First Time on Millennial Media

    Millennial Media has released its monthly Mobile Mix report looking at the smartphone market for the month of December. For the first time, Android surpassed iOS as the largest smartphone OS on the Millennial network, with an 8% increase month-over-month and 46% impression share on the firm’s network in December. iOS currently has a 32% share.

    For context, Millennial’s network is the largest mobile ad network in the U.S. 

    According to the firm, Android ad requests grew 141% from Q3 to Q4 and since January 2010, Android has grown 3130%. When breaking down the revenue generated by apps in Q4, Android had a 55% share as opposed to 39% for Apple. Android also had a 13% increase quarter-over-quarter.

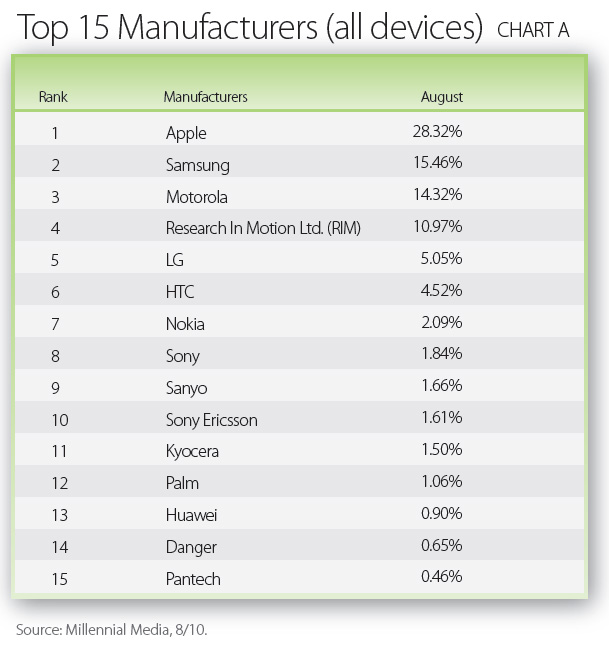
    Apple remained the top manufacturer on the Millennial network (as it has been for the last 15 months), and the iPhone and iPod touch made up two out of the top three of individual mobile devices.

    Top Manufacturers in December

    Top Devices in December

    Apple ad requests grew 12% from Q3 to Q4 and since January, Apple has increased 14%. iPad requests increased 280% from Q3 to Q4.

    HTC came in at number 3 in the Top 15 Manufacturers with a 9% month-over-month increase. "There is a direct correlation with this increase and HTC having the highest number of devices (nine) in the Top 30 Mobile Device-Ranking including the debut of four new devices on the Millennial network: HTC Nexus One (Passion), HTC Evo, HTC Droid Incredible, and the HTC Desire," a spokesperson for Millennial Media points out. 

    As far as carriers, Verizon experienced a 2% increase month-over-month in December. "Verizon’s impression share is likely a result of the popularity of Droid devices and the carrier’s ability to offer 13 of the Top 30 Mobile Devices," the spokesperson said. 

    It will be interesting to see how much Verizon jumps for the February report, with the release of the iPhone for Verizon

    Samsung maintained the number two position in the Top 15 Manufacturers for the third consecutive month.

  • Android Passes iPhone in Revenue on Major Ad Network

    Millennial Media, which claims to have the largest data set of any third-party U.S. mobile ad network,  reports that Android revenue exceeded iPhone-only revenue for its network. Android requests grew by 26% from the previous month,and 1283% since January. 

    Apple, which has been the leading device manufacturer on the firm’s network for the last year, accounted for 0% of impressions in September. iPad revenue growth increased 316% in Q3, with impression growth increasing by 156% in the same period. This comes as Apple just posted its own highest revenue of all time, and record iPhone and iPad sales. 

    Smartphone impression share grew 7% month-over-month and accounted for 58% of the Smartphone, Feature Phone and Connected Device Impression share for Millennial Media. 

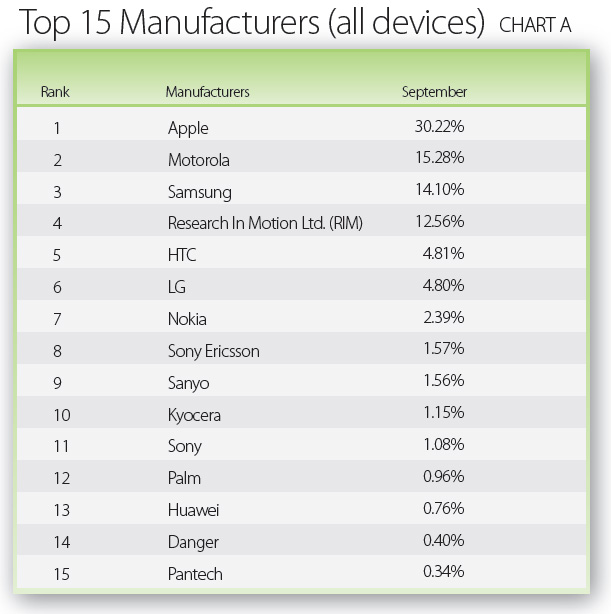
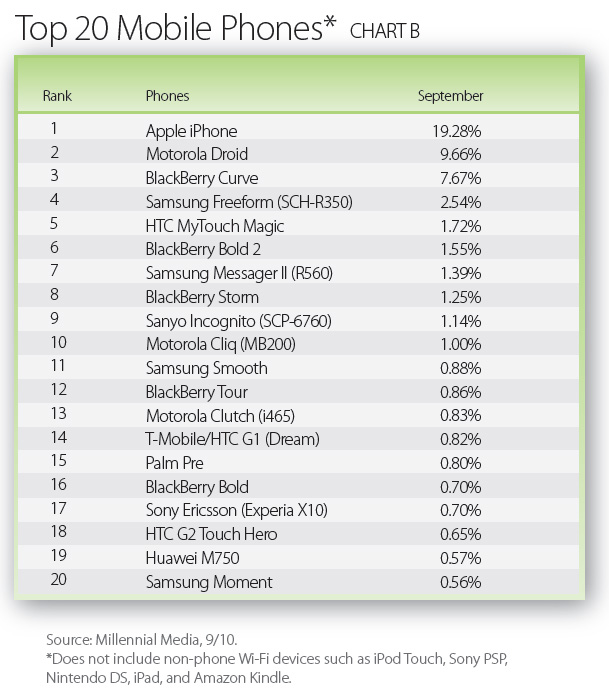
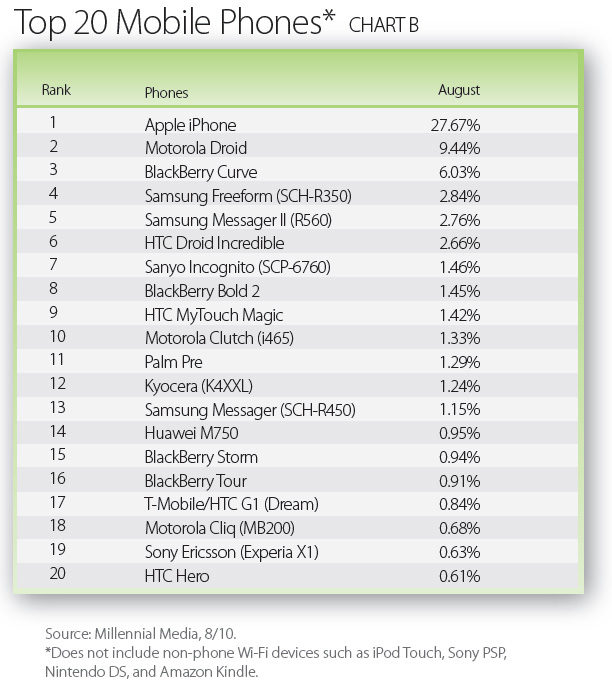
    Here are the top manufacturers and devices for the month, according to the firm:

    Top 15 Manufacturers

    Top 20 Mobile Devices

    As you can see, RIM devices represented 5 of the Top 20 Mobile Phones. The BlackBerry Curve has been number 3 for two months in a row now. Meanwhile, Motorola moved up over Samsung to the number 2 spot on the manufacturer list. 

    The top 4 connected devices were the iPod Touch, iPad, Sony PSP, and the Sony PS3.

  • Signs That Blogging is Not Only Alive, But More Critical Than Ever

    Every so often, one of those "social media vs. blogs" discussions comes up. Questions like "is social media killing blogging?" gets asked. Time and time again, the answer is a resounding "no", but various pieces of news released this week seem to really drive that point home. 

    Blogs: Are they more or less important in the age of social networks? Share your thoughts.

    For one, AOL bought the technology blog TechCrunch for an undisclosed sum (which has been estimated to be at least $25 million) – a blog. Now, AOL doesn’t exactly have the reputation it once had as an ISP, but the company is doing all it can to revitalize itself and rebrand itself as a content-driven media company. The TechCrunch acquisition is a clear example. A Bloomberg article says the move is a possible way to "restore lost relevance". You may recall that AOL got rid of its social network, Bebo

    Is social media dead? Just kidding. 

    Forrester Research released a report indicating that content creation on social networks has slowed, despite global social network usage increasing. "A lack of growth in social creation translates into a lack of fresh ideas, content, and perspectives," said Forrester Research Consumer Insights Analyst Jacqueline Anderson. "For example, one-third of online consumers in the US regularly watch user-generated videos on sites like YouTube. But, only 10 percent of US online consumers upload videos they’ve created to public sites. The traits required to create social content are unique, and at this moment, the consumer market interested in these behaviors has plateaued." (emphasis added)

    Still, I have seen no shortage of people sharing content on Facebook or Twitter – content that more often than not comes from blogs. And I’m not just friends with a bunch of bloggers. 

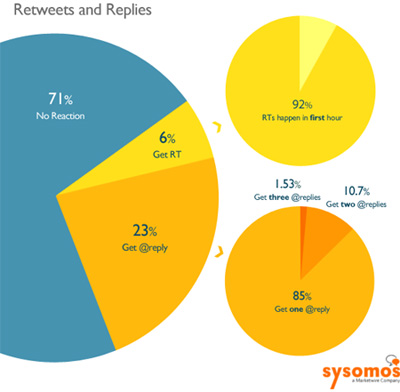
    According to new research from Sysomos, about seven out of every ten tweets fail to earn replies or retweets. Covering the research, our own Doug Caverly writes, "Surprised?  So were we. Twitter’s gained a reputation for being a place to hold conversations, not give speeches. Still, Sysomos examined 1.2 billion tweets that were posted in the last two months before reaching its conclusions, so it’s pretty much a fact that just 29 percent of tweets produce reactions."

    "Otherwise, Sysomos determined that the majority (79 percent) of those reactions are replies," adds Caverly. " Only 21 percent of reactions come in the form of retweets."

    That may say something about Twitter as a means of producing content, but I still believe that Twitter can be a very powerful tool to create content and news. That has been proven time and time again (the Hudson River plane crash comes to mind). However, there is still plenty of "noise" and just like in real life, most of what people say isn’t worth repeating. I will say, however, that most of the retweets I see contain links, and those links very often point to content from blogs. 

    I think I would go so far as to say that from a business perspective, blogging is probably more critical than it has ever been, and social media is largely responsible. This is not because people are engaging less with social networks. It’s because they’re engaging more, and social networks open the doors for blog content to find its way to relevant audiences like never before. 

    Look at Facebook’s social plugins (including the "like" button). 2 million sites have added Facebook’s social plugins since they launched five months ago. "Likes" are now more important to search, as Facebook has made updates so that "liked" news stories appear when people do searches within Facebook. Google is champing at the bit to get this information (and CEO Eric Schmidt thinks they will one way or another). 

    Whether or not Google ever does get access to Facebook’s data, it’s in there to be searched, and much of that comes directly from blogs. Of course Google has no trouble indexing the blog content on its own, it’s more about the popularity and relevance of the content at the personal level. Facebook’s methods for this are simply another reason to create good content, and there’s probably no better or easier means to do so than with a blog. 

    I mentioned business. One more nugget of research released this week comes from the Pew Internet & American Life Project, which found that more than half of Americans do online research before making a purchase. How much of that research do you think comes from blogs – whether they find it through search or through social? 

    Do you think blogs are critical for business? Tell us what you think.

  • Report: Android Continues Market Share Growth

    Millennial Media has released its Mobile Marketing Mix report for the month of August. Among its findings are continued Android growth, as well as significant iPad growth. The firm points to the following as the highlights:


    – The Android impression share increased 7% month-over-month, and now makes up 26% of the Millennial network.

    – The iPhone remained the top mobile phone on the Millennial network (by a significant margin), and iPad requests increased by 76% month-over-month

    – In breaking down usage of the mobile web by carrier-7 different carriers had at least a 9% market share

    – 45% of Blackberry users are Women (more BB stats on page 4)


    Here are the charts for the top manufacturers and devices in August, according to Millennial Media:


    Manufacturers in August


    Top Phones in August

    The report also looks at some interesting info regarding RIM’s BlackBerry platform and data regarding its users. For example, the average income of BlackBerry users is 13% higher than the smartphone average. 


    The entire report can be found here
  • Report: Mobile Broadband to Reach 1 Billion Connections in 2012

    The worldwide mobile broadband market will reach 1 billion connections during 2012, segmented by 3G and 4G network technologies, according to Pyramid Research.

    "Mobile operators around the world will invest billions in the spectrum and network infrastructure to deploy 4G networks, but are struggling to keep pace with 3G data traffic growth driven by the use of smartphones and USB dongles, as well as bandwidth-intensive video content and applications," says a report from Pyramid and Heavy Reading. "These challenges require a transaction-based business case that allows them to more fully monetize the broadband traffic generated by mobile Internet services, content, and applications."

    Berge Ayvazian "Operators planning to deploy 4G networks face many technical, strategic, and business complexities in how to manage their network evolution and critical questions on how to get a return on their investments," says Berge Ayvazian, Senior Consultant, Heavy Reading, and Director, 4G Consulting Practice.
    A separate study from ABI Research finds that mobile data usage continues to grow exponentially as 3G technology spreads globally. The firm says that from 2009 to 2015 data usage in Western Europe and North America is expected to increase at a compound annual growth rate (CAGR) of 42% and 55% respectively. In 2010, the average North American user is expected to consume 159 megabytes of data – up from 100 megabytes in 2009.

    "Mobile voice has already been surpassed by mobile data traffic on some networks, and this trend will only accelerate," says ABI Research wireless analyst Bhavya Khanna. "This boom in usage is driven by the rapid adoption of smartphones in these markets."

    ABI notes that the explosion in data traffic doesn’t mean a corresponding rise in data revenues for operators, as the popularity of unlimited or fixed price plans caps revenue even as usage grows. However, AT&T may have set a precedent with its new rates that find those fixed price plans harder to come by in the future.

  • Email Still Beats Social Networks for E-Commerce

    A new report from Econsultancy suggests that email still beats social networks when it comes to marketing for e-commerce. The report says that over a third (37%) of consumers don’t use a social networking site, and that those who have become a "fan" or "friend" of a company or brand online are still in the minority.

    Is email marketing more effective than social media for you? Let us know.

    The report is based on a survey of over 1,400 U.S. consumers, which the firm calls "nationally representative."

    While Facebook may think email is "probably going away," marketers are still having a great deal of success with it. And just as increased mobile adoption continues to fuel social media use, it’s not exactly hurting email.

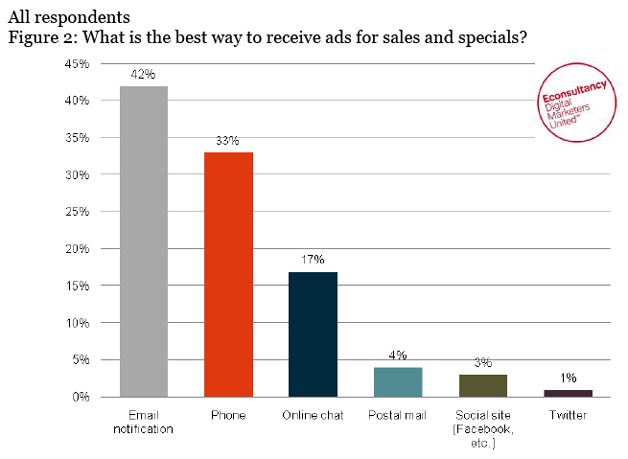
    The report suggests that the rise of mobile will continue fuel email’s success. It notes that each generation of chipsets moves mobile devices closer to the personal computer. "Advanced behaviors today (accessing the Internet or checking email from a mobile device) will clearly soon be commonplace, at least for people in their working years. Nearly two-thirds of people under 24 have checked email on a mobile device," Econsultancy says.

    Best way to receive ads? - Email

    "Online product research contributes a far larger percentage of total retail than the 8% directly attributed to e-commerce, while the evolving nature of digital interaction and customer service is changing the fundamental relationship between companies and consumers," says Econsultancy’s US Research Director, Stefan Tornquist. "The winners will be those who use digital communications most effectively, to influence and enable both online and offline purchases."

    "Although a variety of media are competing for consumer attention, email continues to be the desired channel for many types of commercial communication," adds Tornquist. "Social networking and its effect on the nature of brand is the hottest topic in digital marketing, and deservedly so. It’s still worthwhile for marketers to remember that social network adoption is far from maturity."

    The entire report can be found here.

    Of couse, it’s not really a competition between social media and email. Both should be part of your marketing arsenal, and are effectively used together all the time. For example, another recent study from ExactTarget found that nearly 40% of consumers visit Facebook and Twitter to supplement the news, information or deals they receive via email marketing.

    In what ways do you incorporate social media into your email strategy? Share with other WebProNews readers.

  • Symantec Reports the Most Spammed States in the U.S.

    Symantec has released its annual MessageLabs Intelligence Special Report, ranking the most spammed U.S. states and territories.

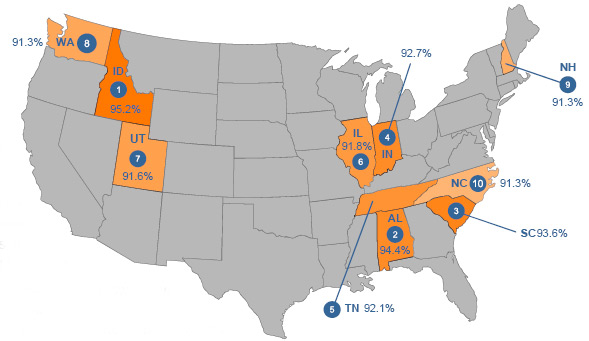
    According to the report, Idaho receives the most spam (for the second year in a row), at a rate of 95.2%. The top spammed states are Idaho, Alabama, and South Carolina, with spam rates above 93%. The national average is only 89.3%. Indiana, Tennessee, Illinois, Utah, Washington, New Hampshire and North Carolina are next in line.
    Symantec - Most Spammed States in the U.S.
    The least spammed states and territories are Puerto Rico, Montana and Louisiana. Puerto Rico returns as the least spammed for the second year in a row.

    As far as industries, the most spammed are engineering, automotive and construction, while the least spammed are finance, admin/business support services and public sector.

    According to Symntec, SMBs receive more spam than enterprises. Areas with greater populations of small-to-medium sized businesses are likely to receive the greatest proportion of spam, the company says. They also note that the least spammed areas are often home to some of the largest companies.

    The report in its entirety can be found here (pdf).

  • Opera: Most Mobile Data Consumption Comes at Night

    Opera has released its new State of the Mobile Web report. In the report, Opera finds that 8:00pm through 12:00am are the peak hours for mobile data consumption.

    "Regardless of differences in economy, culture or location, those four evening hours account for a disproportionate amount of mobile data consumption," the company says.

    Opera’s report is based on usage of its own Opera Mini browser, which certainly isn’t representative of all mobile usage, but it does have a lot of users, and the stats are worth noting.

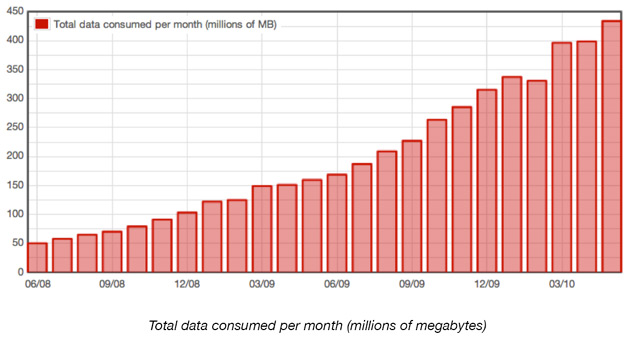
    Opera Shares Data Consumed Data

    Opera Highlights the following global trends:

    – In May 2010, Opera Mini had over 61.4 million users, a 4.2% increase from April 2010. Since May 2009, the number of unique users has increased 142.0%.

    – Opera Mini users viewed over 28.3 billion pages in May 2010. Since April, page views have gone up 7.7%. Since May 2009, page views have increased 193.8%.

    – In May 2010, Opera Mini users generated over 433 million MB of data for operators worldwide. Since April, the data consumed went up by 8.8%. Data in Opera Mini is compressed up to 90%. If this data were uncompressed, Opera Mini users would have viewed over 4.0 petabytes of data in May. Since May 2009, data traffic is up 171.8%.

    – Indonesia passed Russia to claim the top spot for Opera Mini usage, Nigeria jumped ahead of Ukraine, and South Africa leaped ahead of the United States. After the changes, the top 10 countries for Opera Mini usage in May 2010 were: Indonesia, Russia, India, China, Nigeria, Ukraine, South Africa, the United States, Vietnam and the United Kingdom.

    "Our servers compress more than four petabytes of data each month, and that number shows no signs of slowing," said Jon von Tetzchner, Co-founder, Opera Software. "As more consumers use increasingly vast amounts of mobile data, it looks like we will need more people looking after our servers in the evening hours. The heaviest mobile browsing worldwide occurs between 8 p.m. and midnight, regardless of where people live, their current economic situation, or the availability of broadband."

    Some more stats from the report are highlighted here, and the entire report itself can be found here. A significant amount of the report focuses on trends in Latin America.

  • Cheaper Knock-Off Phones Reportedly Doing Well in Smartphone Market

    According to a new report from ABI Research,  Smartphone shipments are expected to grow 21% this year to 224 million, but "Shanzai" devices may be getting a fair share of consumers’ money.

    BlueBerryABI Research VP of forecasting Jake Saunders says, "While there is considerable fanfare and interest around the latest iPhone and Android phones from Apple, HTC and Motorola, ‘White Box’ or ‘Shanzai’ handset manufacturers are rapidly reshaping the low-cost handset segment as they redefine the ‘look and feel’ of the low-cost/ultra-low-cost segments."
    "Many of these low-cost handset ‘brands,’ such as the ‘BlueBerry’ handset, sail pretty close to trademark infringement," the firm says. "While it has ‘Bold’ looks, RIM definitely does ‘not’ manufacture it. These handsets have very localized distribution, lack the full functions of the originals, and cater to end-users who, while they may not have deep pockets, do aspire to be smartphone users. These limited-function handsets, along with other low-cost models, will notch up 219 million sales in 2010."

    Of course the real deals will be doing quite well too. Apple’s new iPhone 4 is already off to a pretty solid start, despite a list of complaints among users.

  • What’s the Best Way to Market to Mobile Users?

    Dynmark has released a report based on a study of creative marketing agencies’ use of mobile marketing. The firm spoke with figureheads from agencies including Ogilvy, Gyro HSR and Essence Media.

    What ways do you use mobile in your marketing mix? Discuss here.

    The main theme of the report is that permission and trust are essential to SMS marketing survival. "Despite its superior reach, commercial messaging is vying with other forms of mobile media like never before," says Dynmark CEO Oscar Jenkins. "Messaging is no longer the only mobile marketing option and the industry has to be extremely careful about how it is performed, otherwise consumers could be turned off for good."

    "The agencies canvassed had no direct allegiance to specific technologies, which allowed them to give us candid views: how much budget they allocated to mobile, how effective campaigns work today: where the potential is and what the pitfalls are," adds Jenkins. 

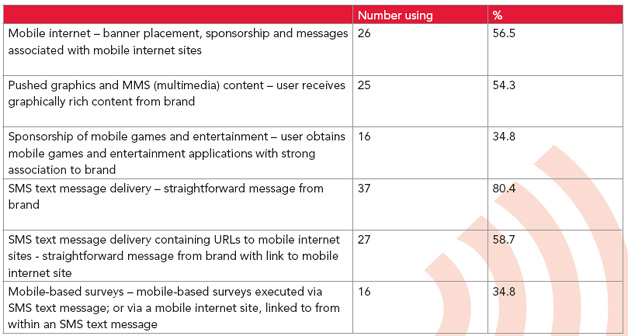
    Here are a couple interesting charts from the report:

    Mobile Marketing Techniques Used

    Mobile Strategies - Techniques used

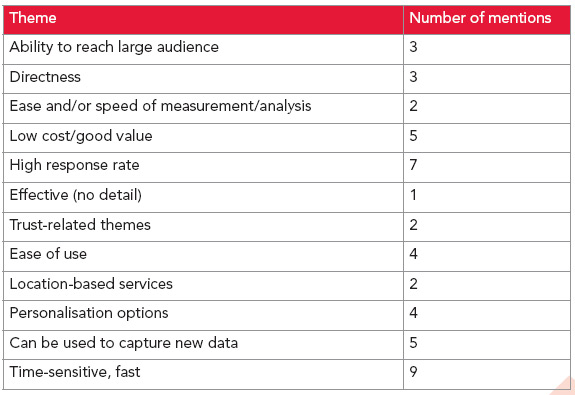
    What are the main advantages of mobile marketing?

    Advantages of Mobile

    The entire report can be found here (pdf). It also looks at agencies’ current use of mobile through brands, active mobile billing ratios (within the context of other media spend), projected mobile billing ratios, commentary around the practice of mobile marketing, regulatory obligations, and creative scope vs. technical limitations.

    Which mobile marketing strategies do you find the most effective? Comment here.

  • Demand Media Responds to Domain Audit Report Accusations

    Update: Quinn Daly, senior vice president, Corporate Communications at Demand Media has gotten back to us with the following comments:

    eNom is the largest domain name wholesaler and we take this responsibility very seriously. We cooperate with multiple law enforcement agencies, as this is our policy and meets ICANN requirements.  Customers suspected of using eNom products and services for illegal purposes are investigated and appropriate action is taken.

    In this case, LegitScript and KnujOn do not represent law enforcement. LegitScript is a pharmacy trade organization, and KnujOn is an individual whose research has been called into question in the past.

    We can confirm that we received the complaint issued by LegitScript and KnujOn, and the complaint is currently under review.

    Original Article: KnujOn.com has released a report and corresponding press release claiming that Demand Media’s domain registrar eNom may be knowingly sponsoring fraudulent pharmaceutical networks.

    Here are a couple paragraphs from the release:

    Our findings are shocking and go a long way to explain the prevalence of cybercrime and spam. While the major focus of the report concerns policy failures, in most cases we connect this with illicit Internet drug traffic. Registrars are the companies that sell domain names and 162 of them may be violating their contracts to the ultimate benefit of widespread criminal networks. 80 Registrars are blocking their WHOIS access. Several Registrars have bad WHOIS for their own websites.

    Most troubling, one of the largest Registrars eNom (DemandMedia) may be knowingly facilitating the illicit traffic of rogue pharmaceuticals. eNom has been notified they are sponsoring fraudulent pharmacy networks and are in violation standards set by the National Association of Boards of Pharmacy. One network in particular is the GlavMed network, a criminal group that uses spam to advertise illicit sites. eNom pays in excess of half a million dollars per year to ICANN in fees alone and is by far one of the largest Registrars.

    Fraudulent pharmacy sites allegedly hosted on enom domains

    Image from the report

    The whole report is here (pdf).

    We’ve reached out to Demand Media for comment on this and will update when we we receive it.