WebProNews

Tag: analytics

  • SocialGrapple Acquired by Google

    SocialGrapple Acquired by Google

    Google has acquired the team behind SocialGrapple, a social analytics service. A message at SocialGrapple.com says:

    I am excited to announce that the SocialGrapple team is joining Google.

    SocialGrapple started a year ago, and launched only a couple of months later as a social graph analytics service. It was an amazing learning experience and I am incredibly grateful to all the users who supported this venture. Much of what was built over the months came directly from your needs and requests, so I feel like we were all on this journey together.

    Since the first launch, we also explored keyword tracking and branched out to other social networks, but this was only scratching the surface. I’m looking forward to taking these ideas to the next level and revealing metrics on an incredibly larger scale.

    Thank you again for being a part of my journey. I strive to continue building tools that make the world more transparent and empowered, and I can’t imagine a better partner than Google.

    According to Leen Rao, it’s just a talent acquisition. It’s unclear whether or not the product itself will remain available. Dain Binder, who first reported the news, says Google confirmed that creator Andrey Petrov is joining Google, but was “silent about whether or not any assets or property of SocialGrapple” are part of the acquisition.

  • New Facebook Tools & What They Mean for Brands

    Facebook’s new Page Insights have a lot of brands excited, and for a good reason. The upgraded tool not only shows impressions and “Like” data, but it also goes beyond these metrics in order for brands to grasp the full reach of their marketing efforts on Facebook.

    Have you tried out Facebook’s new Page Insights? Let us know.

    Webtrends was one of the select companies included in the Alpha testing of this tool and Justin Kistner, its Director of Social Products, talked with us specifically about how brands could use it. According to him, the most significant part of the improved tool was the new focus on engagement.

    Kistner believes there are 4 levels of social measurement including obtaining fans, driving engagement, finding a value proposition, and retaining and growing the value. Up to this point, the tool has been focused on the first level of measurement, but the new Page Insights helps the world understand the importance of engagement.

    “In the past, brands have all been focusing on how you grow your fans, and now they’re going to focus on how you grow engagement,” said Kistner.

    As the image shows, Facebook also introduced a new metric called “People Talking About This” with the new Page Insights. This metric combines all the levels of engagement including likes, comments, shares, as well as video plays, RSVPs for events, and check-ins. The tool takes this data and displays how it performed on a weekly basis, as seen here:

    Webtrends also introduced a tool called Hoverstats that works with Facebook Page Insights to help brands understand more about their pages. Hoverstats, specifically, looks at the effectiveness of the posts that brands push out through Facebook. The core feature of this tool is the Post Strength Indicator (PSI), which scores each Facebook post based on the total reach and engagement.

    “Giving them a lot of data actually makes it harder to understand, so what we wanted to do was take all of that and boil it down into a single number,” said Kistner. “That way the page admin can know whether or not the post they put out was effective.”

    As Kistner went on to explain, marketers need to understand engagement in order to be effective on the Facebook platform. The way engagement works on Facebook is actually similar to how ranking factors work on Google. For instance, when a brand pushes out a post, it doesn’t immediately reach all of the fans. Instead, a brand needs to have engagement in order to break through Facebook’s EdgeRank algorithm and show up in the News Feed.

    “So, what this new data is gonna do and what our new tool helps with that new data is really understand how your posts are driving engagement, and therefore, if you’re getting the reach that you so desire from having that audience,” explained Kistner.

    Facebook’s new Page Insights are already available, and Hoverstats is available through a Google Chrome plug-in. Kistner told us that Hoverstats would also be available for other browsers in the near future.

    In what ways do you see these free tools helping your marketing efforts on Facebook?

  • Ads, Search, Analytics & Star Wars Music

    The video round-up is strictly business today. Well, almost. There is some pretty sweet Floppy drive music and some business-based comedy from an Onion guy. But plenty of marketing material too.

    View other daily video round-ups here.

    Baratunde Thurston of The Onion talks IAB MIXX Awards:

    Floppy music DUO plays the Imperial March from Star Wars:

    WebProNews interviewed Steven Wyer of ReputationAdvocate.com about rebuilding your online reputation:

    YouTube presentation looks at YouTube API and the news:

    Google shares some lessons from Animal Planet and Volvo on how display builds brands:

    Google has a new surfing-based “Search Story”:

    Google announced Google Analytics Premium:

    Adobe put up Digital Enterprise platform in 10 Minutes:

  • New Facebook Tools to Help Your Page Grow

    If you haven’t noticed, Facebook has been making a whole lot of changes lately. Many of them – and certainly the most talked about ones – have been based on the main news feed experience. However, there have been some other lower profile changes to Pages.

    Still, as lower-profile as they may be, they could help businesses grow their Pages tremendously in the long run.

    For one, there is a new “Friend Activity” tab on the left-hand side of the page (pictured above). This shows a user any activity their friends have engaged in related to your page. Simply put, this gives users more reasons to engage with your page. If they click that tab and see various likes and comments that their friends have left, it can encourage them to join those conversations, like the same things, etc. Given the nature of Facebook, especially with the new ticker feature on the right, people are more likely to see this activity than ever, so it’s very possible that even more people will get engaged with your page.

    Second, Inside Facebook is reporting that some Page admins have gained access to per post impression data in Insights Exports. While it’s not rolled out to everyone, this could help brands track their performance, and specifically analyze things like what time of the day posts do better and what kinds of posts do better. Josh Constine reports:

    Some Facebook Page admins are now seeing a new tab called “Per post” in the data exports from Page Insights. Data in the tab includes impressions per post and the total percentage of a Page’s fans that left feedback on the post. Previously, admins could only see daily impressions and feedback data in Insights. Per post data could only be found on a Page’s wall below the posts themselves, forcing admins to manually copy down impression and feedback data.

    If rolled out to all Page admins, the addition of per post data to Page Insights will make it easier for brands to track what kinds of posts and timing result in the higher exposure and engagement.

    These are just a couple of minor additions to the Facebook Page experience, but if utilized well, could really help your business’ Facebook presence.

    Today, Facebook is holding its f8 conference, and has plenty more announcements in store, so check back to WebProNews for more updates about what Facebook does, and I’m willing to bet there will be even more ramifications for businesses.

  • Blekko Launches “Web Grepper” Analytics Tool

    Blekko Launches “Web Grepper” Analytics Tool

    Blekko announced the launch of a new search analytics tool Web Grepper.

    “The Web Grepper searches for unique data information and trends that are embedded in code and cannot be found on any other search engine,” a spokesperson for the company tells WebProNews. “For example, you could search to see how many pages request your user information when you visit, the types of  targeting information the site collecting, or how many sites have ‘Like’ vs ‘+1’ buttons, etc.”

    CEO Rich Skrenta says, “With Web Grepper, we’re offering our users unique access to the blekko index and embedded information that cannot be found on other search engines. “This allows users to uncover incredibly useful data that was previously inaccessible through a keyword search.”

    Blekko Web Grepper

    Users can submit questions to the tool and the Blekko community votes on a daily basis on which questions will be analyzed.

    This is an extension of the whole community-driven philosophy behind Blekko – and ultimately search in general. See Blekko’s slashtags.

    The results will be displayed in a report.

    Blekko says it will make sure it’s not being used as a hacking tool to get personal info by manually reviewing “greps” and monitoring malicious data mining behavior.

  • Twitter Launches New Web Analytics Tool

    Twitter Launches New Web Analytics Tool

    It’s been a point of contention for some time now: just how much traffic does Twitter actually drive to your site? The general thought is “probably more than you think,” as web analytics tools are apt to under-report your Twitter referrals.

    Why? Basically, because Twitter’s API gives access to so many different third-party apps and various other social sites. Many of your referrals that are actually coming in by way of Twitter might not show up as referrals from Twitter.

    A study we reported on in July found that only 24.4% of clicks on links shared on Twitter actually had twitter.com as the referring site. 13% of clicks from Twitter had another site as the referrer like Facebook or LinkedIn. And 62.6% of clicks from Twitter didn’t have any referral information at all.

    In a nutshell, Google analytics might be listing your traffic from Twitter as traffic from Facebook or direct traffic or a number of other things.

    A few months ago, Twitter announced that all links shared on Twitter.com as well as through third-party apps using Twitter’s API would contain a special t.co URL. In theory, this helps referrals from Twitter actually show up as referrals from Twitter.

    Today, Twitter is doing more to ensure that you know exactly what you’re getting from their service. They have announced Twitter Web Analytics, an analytics tool “driven by the acquisition of BackType” (BackType is a social analytics startup that Twitter snatched up back in July).

    Twitter is a powerful platform for websites to share their content, and drive traffic and engagement. However, people have struggled to accurately measure the amount of traffic Twitter is sending to their websites, in part because web analytics software hasn’t evolved as quickly as online sharing and social signals.

    The tool will let you see the amount of traffic being sent toy your site by Twitter referrals, let you “understand how much your website content is being shared across the Twitter network,” and also gauge just how effective that Tweet Button on your site really is.

    With the tool, you can also see your most-shared links by day, week or month – either based on Tweets or by clicks.

    The tool will be rolled out to a small test group this week and will go public in the next few weeks. An API is also on the way, although no specific timeframe was announced.

  • Why You Can Almost Guarantee Google is Using Your Analytics Data

    Why You Can Almost Guarantee Google is Using Your Analytics Data

    While many webmasters and publishers use Google analytics without a second thought, smart publishers, marketers, and SEOs are left to speculate… Is Google using this data? What might they use it for? And am I doing myself more harm than good using it?

    Truth be told, unless Google ever does a full disclosure about analytics data (which to date hasn’t happened), we are left to conjecture and guess. However, if we look at Google’s business decisions, especially since Larry Page has assumed control, the only conclusion you can logically come to is that yes, they are using it. But let’s not get ahead of ourselves.

    Conference attendees have been using Q&A sessions to try and pin down Google engineers about whether or not they are using bounce rate, exit rate, time on site, or other specific factors. But, by asking these narrow questions, they allow the engineers to sidestep the real question with carefully worded answers. What we need to do is stop trying to figure out exactly what factors they are using so we can try and exploit them–instead, we need to get answers to the larger question: “Is data from Google analytics currently used in search engine ranking pages?” Why is focusing on Google’s use of one factor bad? Much like that kid in class who asked “Is this going to be on the test?” you’ve lost the plot. That kid has stopped focusing on learning and simply wants a good grade by regurgitating specific facts back to the teacher. It’s unlikely that Google is looking at any single factor; instead, they are looking at more than one aspect to determine overall quality. Engineers from Google constantly tell us to stop focusing on these narrow factors (like pagerank) and focus on the big picture and what it says about our website.

    Ever since Larry Page has assumed control, one of his big focuses has been shuttering some of Google’s non profitable projects, like Google Labs. It’s not that Google is no longer innovating; it’s that they are taking a more pragmatic approach. Projects need to be cost effective, and they’re not giving them the same length of time as they did in the past to get to that point.

    Let’s take a look at analytics. Maintaining uptime for the massive number of sites that Google analytics runs on requires a huge investment in hardware, software, and skilled engineers and technically skilled labor. Next we need to add in the programmers, Q&A, and resources associated with maintaining and updating the user interface/reporting side of gGoogle analytics. Simply put, it’s a huge investment of time, resources, and money. With Google’s recent shift in direction about projects needing to be profitable to stay alive, there simply isn’t any logical conclusion you can reach except that they are using the data. There’s a true saying about this situation: “if you aren’t paying for a product or service, you are the product being sold“.

    There are multiple business uses for this data, including forcing up prices on adwords keywords, determining adwords quality scores, understanding consumer usage, and validating organic search engine ranking factors–to name just a few. Yes, Google adwords may have started as a supply/demand bid driven market system, but once adwords quality score got factored in, it became a black box model and prices could be raised artificially as needed. Don’t believe me? Try and explain why quality score forces me to bid $5 to display ads for my own name in adwords, but I can show ads for Matt Cutts for $0.30. Unless, of course, you want to defend the bizarro logic that I am more relevant for someone else’s name than I am for my own.

    The real takeaway here is that Google is the data Borg. Without feeding the Borg signals that people are visiting, using, and returning to your site, you have little chance of ranking organically. These are the types of signals that real businesses and brands will send the search engines. These are the signals that become difficult and expensive to fake without large distributed botnets, malware, or hacking. The question you need to ask yourself is at what point does it become easier to spend more time building these signals the right way and less time on faking it via black hat spam techniques …

    Check out Graywolf’s SEO Blog for more articles by Michael Gray

  • Add Multiple AdWords Accounts to One Google Analytics Account

    Add Multiple AdWords Accounts to One Google Analytics Account

    Google announced that you can now link multiple AdWords accounts to a single Google Analytics account. This functionality comes with a new “data sources” section in the account settings in GA, where you can use auto-tagging with multiple AdWords accounts and import AdWords data into GA.

    Google provides a step-by-step walk through for setting this up here.

    Multiple AdWords accounts in Google Analytics

    Multiple AdWords accounts in Google Analytics

    “Before you start, make sure that you’re using a Google account that has access to both your Google Analytics and AdWords accounts, and is an Administrator for the Analytics account,” notes Gavin Doolan of the Google Analytics Team.

    In addition to this new functionality, Google has also made it easier to import Adwords data into multiple profiles in GA:

  • Google Adds Multi-Channel Funnels to Google Analytics

    Google announced a new set of five reports in Google Analytics today called Multi-Channel Funnels.

    In Analytics, conversions and ecommerce transactions are credited to the last campaign, search, or ad that referred the visitor when he or she converted,” Google says in the help center. “But what role did prior website referrals, searches and ads play in that conversion? How much time passed between the visitor’s initial interest and his or her purchase?”

    “The Multi-Channel Funnels reports answer these questions and others by showing how your marketing channels (i.e. sources of traffic to your website) work together to create sales and conversions,” it says.

    The reports are generated from conversion paths and sequences of interactions (clicks/referrals) from the 30 days that led up to each conversion/transaction. Conversion path data looks at paid/organic search, referral sites, affiliates, social networks, email newsletters, display ads, custom campaigns, etc.

    Here are a couple videos about Multi-channel funnels, including a walk-through:

    Google Analytics users can use the reports by clicking on the My Conversions tab. AdWords customers are encouraged to link their accounts with their Analytics accounts.

    Starting today, Google says, uses will see complete data in the reports for the past two months, but they’ll be expanding it to include data dating back to January over the coming days.

  • Twitter Referrals Easier to Track in Analytics Now

    Twitter Referrals Easier to Track in Analytics Now

    A little over a month ago, we talked about how many websites might be getting a lot more traffic from Twitter than they realize. This is largely due to the way analytics programs handle links from the many available sources of Twitter curation.

    Essentially, as social media analytics firm awe.sm pointed out, analytics software has not been counting all Twitter referrals as Twitter referrals, mainly due to the fact that Twitter is accessible through a variety of channels via its API. That includes third-party clients and other sites that serve tweets. Many people link their Twitter accounts to their Facebook or LinkedIn accounts, for example, so in such cases, Twitter may have really been driving some of the referrals from those sources.

    “When a user clicks a link in any kind of non-browser client, from Outlook to a desktop AIR app to the countless mobile and tablet apps, no referrer information is passed for that visit and your analytics software basically throws up its hands and puts the visit in the ‘Direct Traffic’ bucket,” explained awe.sm’s Jonathan Strauss, the author of the report. “The assumptions behind this fallback behavior show just how arcane referrer analysis is — if a visit didn’t come from another webpage (i.e. no referrer data), someone must have typed the URL directly into their browser address bar.”

    According to The Next Web, starting last Wednesday, “all links (longer than 20 characters) posted on Twitter.com or any Twitter client have been wrapped with a t.co URL. This means all analytics tools are picking up ‘t.co’ as the referrer as opposed to a particular twitter client (Twitterrific, Tweetdeck etc.) or just twitter.com.”

    So, you may now be seeing more “t.co” traffic, which is a better indicator of the traffic you’re really getting from Twitter. That said, it doesn’t appear to be a perfect representation. Just looking at our own Analytics, we can still see referrals from other Twitter-related sources, but t.co is certainly more prominent now.

    “Link wrapping provides an opportunity to learn how users engage with links contained in tweets,” Twitter says in the t.co FAQ. “After the full t.co rollout is complete and our analytics has crystallized, we’ll be offering a set of APIs that developers can leverage to enrich their applications with gathered data.”

    Twitter link shortening

    In June, Twitter began rolling out automatic link shortening on Twitter.com. After 13 characters of a URL are entered, Twitter will show a message letting the user know that the link will be shortened, and the link will be assigned a t.co URL, though the link will still appear to be a shortened version of the original.

  • Are You Sure You’re Not Getting More Twitter Traffic Than You Realize?

    Are You Sure You’re Not Getting More Twitter Traffic Than You Realize?

    Social media analytics firm awe.sm has a very interesting post explaining why webmasters might be getting a lot more traffic from Twitter than they realize. This has sparked some interesting discussion around the tech blogosophere, and quite frankly, it might make you care a little bit more about your Twitter presence.

    Do you think Twitter’s an important tool for driving traffic? Comment here.

    To make a long story short, the report indicates that your analytics software is not counting all of your Twitter referrals as Twitter referrals, largely because Twitter itself is accessible through so many different channels via its API. This includes third-party clients, and other sites that serve tweets.

    After looking at its own data for six months, spanning links to over 33,000 sites, awe.sm found that :

    • only 24.4% of clicks on links shared on Twitter had twitter.com in the referrer;
    • 62.6% of clicks on links shared on Twitter had no referrer information at all (i.e. they would show up as ‘Direct Traffic’ in Google Analytics);
    • and 13.0% of clicks on links shared on Twitter had another site as the referrer (e.g. facebook.com, linkedin.com).

    That last 13% would account for sites that post tweets. For example, people tying their Twitter account to their Facebook and LinkedIn accounts, so that tweets appear there automatically – a fairly common practice. While technically, traffic from these would still be coming from Facebook or LinkedIn in a sense, they are also the result of a link originally being tweeted.

    awe.sm Twitter stats

    As VC and entrepreneur Mark Suster notes, “Many Tweets are now being sent to LinkedIn and then the publisher assumes that the source of the referral is LinkedIn. In some ways it is because that’s where your user engaged the content. But get rid of the Tweet and you get rid of the referral traffic…”

    “When a user clicks a link in any kind of non-browser client, from Outlook to a desktop AIR app to the countless mobile and tablet apps, no referrer information is passed for that visit and your analytics software basically throws up its hands and puts the visit in the ‘Direct Traffic’ bucket,” explains awe.sm’s Jonathan Strauss, the author of the report. “The assumptions behind this fallback behavior show just how arcane referrer analysis is — if a visit didn’t come from another webpage (i.e. no referrer data), someone must have typed the URL directly into their browser address bar.”

    “If you’ve spent the last few years wondering why the proportion of ‘Direct Traffic’ to your site has been on the rise, the answer is the growing usage of non-browser clients, especially on mobile,” he adds. “And since 2/3 of Twitter consumption is happening in desktop and mobile clients*, it’s safe to say that a lot of your ‘Direct Traffic’ is actually coming from Twitter.”

    One area where Twitter won’t help you, at least currently, is Google’s realtime search. The two company’s don’t currently have their previous deal in place. It remains to be seen whether the two will come to terms again. If Google+ gets big enough, Google may decide it can simply do without the Twitter firehose. Likewise, Twitter might want to withhold it for competitive reasons. Some people are already spending less time using Twitter, as a result of Google+‘s emergence.

    There are ways you can optimize for Twitter traffic. For example, as we’ve referenced in the past, Shéa Bennett at Twittercism, came up with an equation for retweet optimization. The concept is basically: consider Twitter’s 140-character limit, consider your user name, and consider how many characters you need to leave free for the person retweeting it.

    “When sharing links and content, I always ensure I leave a minimum of 12 characters at the end of each and every tweet,” he wrote. “This is a great habit to adopt. Otherwise, those wanting to retweet you are forced to edit your submissions so that they can give the proper credit. Because of this extra work, many times, they simply won’t bother retweeting you at all.”

    Of course promoting your Twitter account on your various web presences, and including prominent tweet buttons on your content can help as well.

    Are you getting significant traffic from Twitter? Let us know in the comments.

  • Google on How Instant Pages Affect Analytics

    Yesterday, Google introduced Instant Pages (among several other things), which is a new upcoming feature of Chrome that will instantly load a search result, when Google is confident that it is the one the user is going to click on. It does this by “prerendering” the page, or starting to load it even while you’re still on the results page, so it appears much more quickly when you actually do click on it.

    The above video demonstrates this, and shows how much faster it can be compared to when you’re clicking from a normal Google search. It’s an impressive concept, but it has raised a few questions regarding analytics. Google told WebProNews a little about how it works.

    We had a good question in the comments of a previous article we ran on Instant Pages. AL wrote:

    I am wondering if this is going to impact our site analytics. If they retrieve the entire page – html, images, etc… – then would they not also trigger a visitor in our analytics, whether a visitor does or doesn’t visit our page?

    If so, that would skew even the most basic of KPIs, including bounce rate which could be a ranking signal.

    Another reader, Nick Stamoulis, added:

    That’s a really interesting thought. Since the page is pre-loading, does that get recorded as a visitor? If the user doesn’t click on the link, will that impact the bounce rate?

    As we had not seen Google address this directly, we reached out to the company to get some more insight. A Google spokesperson tells WebProNews:

    Most website analytics solutions assume that one page load is equivalent to one user “impression,” or page view. Although google.com only issues the prerender hint when it is confident that it knows where the user will click, in some cases it will mispredict, resulting in a page that has appeared to load but was never actually shown to the user.  Although this will happen relatively rarely, in some cases it is important for the webpage to know.

    Chrome has implemented a new API called the page visibility API that, among other things, allows websites to detect when they’re being prerendered. You can learn more about that API at our Using the Page Visibility API article.

    Analytics and advertising solutions will have to be updated to take account of prerendering via the page visibility API. In most cases the end site owner shouldn’t have to make any modifications to his page; the 3rd party will simply make a minor change to the javascript that is pulled into publishers’ pages. You should check with your analytics or advertising providers to check if their scripts are prerendering-aware.

    Interesting, and helpful to know. I’m assuming that most major analytics providers will adjust accordingly, but it is definitely something to be aware of.

    The Instant Pages technology is currently in the Chrome Dev Channel, and will be rolling out in Chrome beta this week, with stable and mobile releases coming in the coming weeks. Today, Google’s first Chrome OS Chromebooks became available for consumers.

  • Compete: Comparing Our Data to Google Analytics is Apples and Oranges

    Compete, as you may know, provides analytics tools, and shows website traffic data on things like unique visitors, pageviews, visits, etc. The data is sometimes compared to Google analytics, and often tells a different story.

    We reached out to Compete to discuss this a bit, and Damian Roskill, Managing Director, Marketing at Compete tells us, “It’s really like comparing apples and oranges – both methodologies have their strengths and their weaknesses.  Google Analytics doesn’t actually track people – it tracks cookies.  This means that when people change computers, or delete their cookies, you can have double counting that goes on.”

    Compete’s methodology has four basic components. They are (as described in a Compete white paper):

    1. Multi-source panel – combines both recruited panelists and licensed clickstream data from partners, resulting in a very large and representative online consumer panel;
    2. Harmonization algorithms – proprietary processes and technology that work together to integrate Compete’s multiple data sources into a unified online
      consumer panel;
    3. Sophisticated normalization techniques – unique processes that weight, calibrate and project metrics across panel sources resulting in accurate base audience measurement data;
    4. Metrics that matter – analytics on site visitation, audience profiles, media exposure, search term usage, cross-shopping, conversion, competitive behaviors, and audience segmentation

    “In contrast, a panel is a sample-based approach – we track about 2 million US consumers – a percentage of the total internet audience here in the US – and then we use computer modeling to project behavior from our panel to the general internet audience,” says Roskill. “The upside is that a person is a person – you don’t have the double-counting.  The downside is that you can sometimes get undercounting of smaller websites.”

    “Also notice that we are currently only doing US consumers – so people often send us a Google Analytics number that includes all international users as well as US consumers – the two aren’t comparable in that way either.”

    Certainly an important point to note.
     
    “Bottom line, the approaches are complementary rather than either/or – what should make sense is that the two methodologies should be similar directionally.  But comparing the numbers doesn’t really provide much value.”

    In my experience, they generally are similar directionally in most cases.
     
    “What we think can be meaningful is combining the two approaches – essentially using a cookie-based approach and combine it with a panel based approach and use them to provide validation for each other,” says Roskill.

    The fact is that you can compare data from any number of analytics tools, and you’re going to get different results. It’s when they tell dramatically different stories that you need to investigate further. Luckily there are resources explaining how data is collected. Compete’s white paper, for example explains its methodology. Google Analytics has an entire help center, and there are plenty of articles on the web discussing it.

  • 5 Facebook Insights Metrics to Track – And Why

    5 Facebook Insights Metrics to Track – And Why

    By now, if you work in the digital arena, you’ve most likely taken a glimpse at Facebook Insights. After all, many people have responsibility for managing online communities, like Facebook, and need to track metrics and report back to management on a semi-regular basis.

    Admittedly, Facebook doesn’t offer the most comprehensive suite of data out there. In fact, some folks have figured out work-arounds to install Google Analytics on their Facebook page for more in-depth information.

    But, Insights actually probably serves most brands just fine. It provides basic data that can tell you a lot about if and how you’re fairing on the platform.

    My question is this: Are people just reporting likes and basic interactions? Or, are they really diving into the data, grabbing the right data and translating that into actionable intelligence for the brand?

    Some are. Some aren’t.

    Today, I thought we’d take a look at five key metrics I’ve found to be useful for most brands and how you can take that basic data and make it work for your organization’s marketing efforts online.

    * Tab Views. Just like reviewing Google Analytics on your blog, one of the first things I always want to know is where people are going on my site. On Facebook it’s no different. Which tabs are fans viewing? Here’s where to find out.

    What to do with the data: I had a client where after reviewing Insights recently, we discovered a decent amount of folks were visiting their Discussions tab. Only one problem: We didn’t have any content on that tab. This data forced us to rethink that a bit. People were expecting content in that tab–why? After some discussion around that question, we came up with a strategy I believe will help us improve engagement with “fans” and ultimately, help this client achieve its goals online.

    * External referrers. What are your biggest referral sources online? For most, this will probably be either your Web site or Twitter. But, invariably, other sites will work there way in the mix, too. Why are those sites popping up? It’s your job to figure that out.

    What to do with the data: This one depends on your goals. If you’re trying to drive people to your Facebook page from other channels, this is a great metric to check what’s working and what’s not. If Facebook traffic isn’t necessarily one of your top goals, it’s still worth running down those obscure Web sites that drive people to your page. Maybe it’s a site that picked up a blog post our CEO wrote a while back (maybe there’s a strategy there). Maybe it’s a single tweet a huge influencer in your industry made a week ago. Whatever the case, it pays to investigate–remember, the more informed you are with rich data points, the more effective your decision-making will become.

    * Post Feedback. You’ll find this data under “Interactions” in your Page Overview section. It measures the number of “Likes” and comments made on the posts in your News Feed.

    What to do with this data: Really, you’re looking for the percent increase month-over-month here. If engagement and two-way feedback are among your goals, this is a key stat to track. What’s more, don’t forget to check out the number of “Likes” and “Comments” throughout the month. Where were your spikes? Did they occur where you wanted them to occur? Did the number of “Likes” and comments on a certain post surprise you? Grab all this information here.

    * Monthly Active Users. This metric represents the number of folks who have interacted with (Liked or commented) or viewed (don’t have to be fans) your page or its posts.

    What to do with this data: First, look at the percentage growth or decline month-over-month–that should give you a good indication of how many people are visiting and interacting with your page compared to the last couple months. Then, look at the number against the “Lifetime Likes” number directly to the left–how does it stack up? Remember, the Monthly Active Users number doesn’t just reflect fans–it also picks up non-fans. So, again, if one of your goals is engagement, this comparison is a good one to grab–and it should be a pretty high ratio.

    * Page Views. This number represents the total hits to your Facebook page–and it includes fans and non-fans (including those who aren’t logged it to Facebook). You can find it in the Users tab under “Activity.”

    What to do with this data: Here’s where you can really see what days of the week people are hitting you page–and how the spikes correspond with your content. It might make sense to overlay this chart with the days you post–great way to determine which posts might be encouraging fans to click on your actual page (remember, this isn’t about News Feed views–it’s about actual Facebook page views).

    What about you? What Facebook Insights metrics do you look at from month-to-month? And, more importantly, what do you do with that data?

    Originally published at Communications Conversations

  • Facebook Insights Analytics Tool Gets New Features

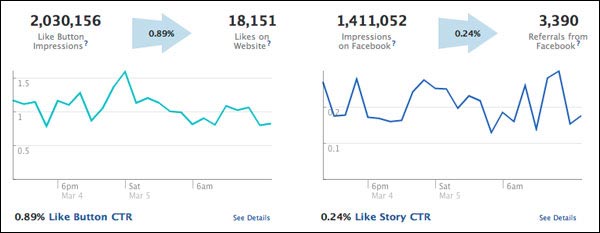
    Facebook has launched a new version of its analytics tool Facebook Insights. The new version, we’re told, includes real-time reporting capabilities for social plugins.

    “The updated analytics tool helps website operators better understand what visitors are interacting with so they can optimize site content and keep people coming back for more,” a representative for Facebook tells WebProNews.

    Facebook Insights Data

    Facebook Insights Data

    Facebook Insights Data

    Facebook Insights Data

    The new version of Facebook Insights comes with:

    • Deeper analytics, including impressions, referral clicks and most popular pages.
    • Real-time engagement: Up-to-the-minute analytics for quick optimization.
    • Access to aggregate and anonymized insights into how people are interacting with content, including impressions of the Like button and Comments plugin and click metrics.
    • Demographic information for interactions based on aggregate, anonymized data. For example, an e-commerce site could see which products are generating the highest levels of interaction from a specific demographic and alter future product decisions based on that data.
    • These new metrics will also be available through the Graph API and can be exported at any time.

    This comes at a time when a lot of website owners are looking for ways to decrease their dependence on Google (and search in general). Facebook is certainly one of the more important sources of potential traffic and engagement.

  • HP Buys Vertica, A Data Analytics Company

    HP announced that it has signed an agreement to acquire a real-time analytics platform company Vertica.

    HP says the pick-up will enhance the company’s capabilities for information optimization, and that Vertica’s platform will help its customers analyze massive amounts of data for "real-time business intelligence."

    "In today’s highly competitive environment, customers need the ability to manage the increasing amounts of data and growing streams of information with more flexible, more dynamic architectures,’ said HP EVP and chief strategy officer Shane Robison. "Vertica’s unique platform combines simplicity with industry-leading performance, allowing HP to leap ahead of the industry in the race to analyze massive amounts of data."

    Vertica Gets Acquired by HP

    "By combining Vertica’s offerings with HP’s brand and global reach, customers will benefit from the commitment, expertise and resources from the largest technology company in the world," said Christopher Lynch, president and CEO of Vertica. "Combined with HP, we will be able to better help customers develop flexible business performance solutions that improve decision making and streamline business processes."

    Financial terms of the deal have not been disclosed. Vertica has reportedly raised  $30.5 million in funding. 

    The deal is expected to close in the second quarter of HP’s fiscal year 2011. Vertica’s products will be available through HP sales and service channels.

  • FeedBurner Re-Design Could Use More Features

    The FeedBurner re-design has been in beta testing for a few months now, but does it make the service better?

    I’m a big fan of FeedBurner and I really like the new look and feel as it’s much cleaner and matches other Google products, however since it’s so familiar, it feels a little lacking.

    At this time there is no way to select a date range other than the pre-defined time periods that are offered, there is no way to export data, and there is no way to tie data points together; such as referring URLs to posts.

    What I’d really like to see is FeedBurner integrate this information into Google Analytics. The two services are very similar in what they do, and how they look, that it feels like they should live together. Hopefully then FeedBurner could utilize some of the great features in Google Analytics to make this data more robust.

    New FeedBurner

    Other than the new design, the only other new item is the fact that it does real-time analytics. This lets you use what impact your new post has on the web moments after you publish it.

    Now if you really have time to sit down and watch your analytics in real-time, good for you. But I doubt many will see this as a usable feature.

    Instead, I’d like to see FeedBurner give users more customization and social interaction.

    Integration into Twitter is great, but what about Facebook? Are there other destinations that could benefit from updates? What about seeing status updates that include our FeedBurner URL so we can really see how it’s being syndicated?

    What about some additional feed customization? The basic ‘clean’ template is ancient in terms of internet age and it’d be nice to see even basic customization like Twitter offers.

    How about the ability to share a FeedBurner account with multiple Google accounts? Much like Google Analytics and Webmaster Tools, sometimes more than one person wants to analyze the data.

    How about some nice charts and data points like Feed Analysis offers? These charts are well received by those that don’t get the data.

    It just seems to me that FeedBurner has just maintained its presence since it was acquired by Google in 2007. Little changes have been happening over the years, but it still feels like it’s not living up to its potential.

    Maybe it’s the lack of competition, or maybe the FeedBurner teams feels it doesn’t need to be any more than it already is, however I’d like to see FeedBurner step up its game and become much more valuable to marketers and site owners.

    Originally published at bloggerdesign.

  • Twitter Sells Data, Provides Analytics, Gives Users “Reputation Scores”

    There are some interesting things going on with Twitter this week, and while they may not be as sexy as Facebook’s news, they could have a pretty big impact on the way Twitter is used by developers and marketers. 

    The Data

    For one, Twitter has partnered with social media data provider Gnip to sell large amounts of public Twitter data. This will come in three sizes: the Twitter Halfhose, the Twitter Mentionhose, and the Twitter Decahose. 

    The "Halfhose" will be comprised of 50% of Twitter’s full firehose, and according to Marshall Kirkpatrick at ReadWriteWeb, who interviewed Gnip CEO Jud Valeski, the price will be $360,000 a year. The "Decahose" is comprised of 10% of the full firehose and costs a reported $60,000 a year. The "Mentionhose" provides a realtime stream of all Tweets that mention a user, including @replies and retweets. Pricing for that one is unclear. 

    "We expect this to be very interesting to businesses studying the conversational graph on Twitter to determine influencers, engagement, and trending content," says Valeski in the announcement.

    "There’s enormous corporate demand for better monitoring and analytics tools, which help companies listen to their customers on Twitter and understand conversations about their brands and products," he says. "Twitter has partnered with Gnip to sublicense access to public Tweets, which is great news for developers interested in analyzing large amounts of this data. This partnership opens the door to developers who want to use Twitter streams to create monitoring and analytics tools for the non-display market."

    The Analytics

    In June, Twitter acquired analytics company Smallthought Systems. In September, a Twitter employee indicated that Twitter would release a free real-time analytics dashboard sometime this year. 

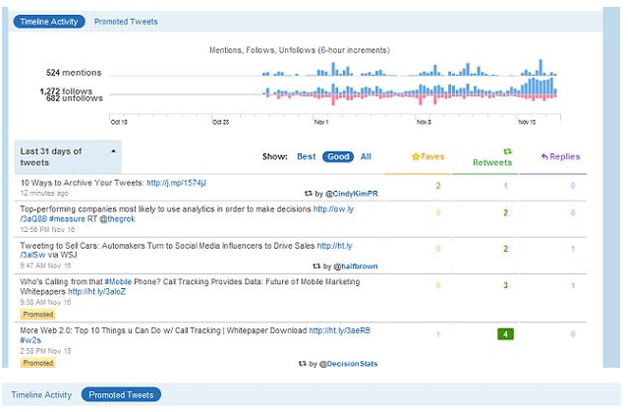
    Mashable’s Adam Ostrow reports that Twitter has now started inviting a select group of users to test the product. He also has a couple screenshots like the one below. 

    Twitter Analytics Image Credit: @mongoosemetrics via Mashable.

    Frankly Twitter analytics are long overdue, and should ultimately solve that problem of "How do I use Twitter?" for a lot of businesses. This will help them understand what’s working and what’s not and allow them to adjust their strategies accordingly. Facebook has offered analytics for quite some time, and provides a great deal of insight into user engagement with Pages. It will be nice to have that kind of look at Twitter engagement.

    Twitter co-founder Evan Williams also revealed at the Web 2.0 Summit that the company calculates a "reputation score" for all Twitter users. This is used to help determine things like which users to suggest to others. Hat tip to Jennifer Van Grove on that one.

    Twitter seems to be maturing as a service, even since Williams recently handed his CEO throne over to Dick Costolo, which has allowed him to focus more on Twitter itself and Costolo to focus more on the business side of things. If these early weeks since that transition are any indication, we can probably expect a lot of useful Twitter features down the road.

  • New Brightcove Offers Deep Video Analytics, Apple HTTP Streaming

    Cloud-based online video platform Brightcove has launched a new version today – Brightcove 5. This comes with increased mobile support, YouTube Sync, Apple HTTP streaming, advanced analytics for HTML5, and more. 

    "At a high level, improvements include advanced distribution methods with more social sharing to help brands get the most mileage, drastically expanded support of mobile platforms, expanded analytics to gauge how online video campaigns are performing, and other backend improvements to video quality," a spokesperson for Brightcove tells WebProNews.

    The Apple-friendliness in particular has caught the eye of the tech community. Integrated Apple HTTP streaming support enables multi-bitrate video delivery for Apple iOS devices, including high quality, long-form video experiences viewable over 3G or Wi-Fi connections.

    Apple HTTP streaming with Brightcove

    "Consumers today are surrounded by an increasingly fragmented landscape of devices and destinations, which present publishers with exciting new opportunities, as well as challenges," says CEO Jeremy Allaire. "Brightcove 5 helps remove the complexity of online video publishing and distribution across multiple devices and touch points, accelerating productivity and unlocking additional value."

    The HTML5 analytics are also noteworthy. "Developed in partnership with TubeMogul, Brightcove 5 introduces new advanced analytics for HTML5 video experiences that make it possible to aggregate analytics for both HTML5 and Flash video experiences across browsers and mobile devices," the company says. "These new uniform analytics eliminate one of the most painful compromises associated with deployment of HTML5 video, delivering comprehensive insight into online video performance for the first time."

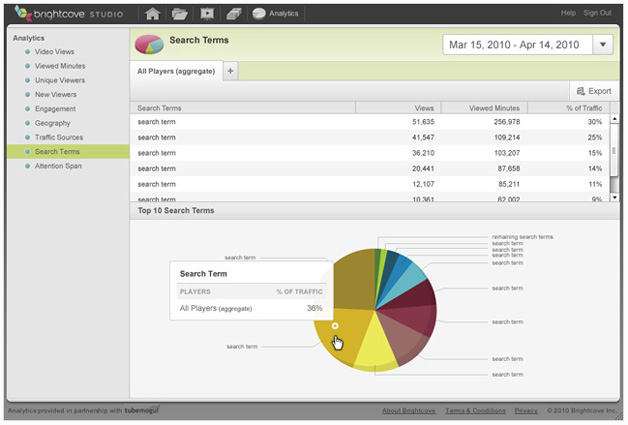
    Analytics from Brightcove

    The new version also introduces over a dozen other new analytics reports, such as player level metrics, top referring search terms, top domains where content is embedded, global viewer attention span, city-level geo info, browser/OS info, etc. 

  • Apigee Launches Private Preview of Premium API Analytics Tool

    In late June, Apigee launched a Facebook API Console, which enabled Facebook developers to learn, debug, interact with and develop on Facebook’s Open Graph API in a more simplified way. Now, the company (formerly Sonoa Systems) has launched a new  line of developer tools.

    The line, features tools for API analytics, management, and debugging. Apigee has three lines in all: enterprise, free, and premium editions. Premium is the new one. "The features will be served ‘a la cart’ as self-service add-ons to the free platform with costs from $50/month up," a representative for the company tells WebProNews. " It is designed to serve the growing market of API providers, ranging from API-focused startups to the thousands of applications, websites, and services now providing APIs."

    Apigee Premium

    Apigee Enterprise is designed to help enterprises use APIs to fuel their mobile, multichannel, application and cloud strategies. It is essentially a rebranded version of what was previously Sonoa Systems’ core product, ServiceNet. According to the company, this has been used by IBM, MTV Networks, Comcast, and many others. 

    Apigee Free is obviously a free platform designed to help developers learn, test and debug APIs, get analytics on API performance and usage, and apply basic rate-limits to protect their services.

    Apigee Premium launches today in private preview, and provides advanced features on top of the Apigee Free platform, including unlimited API traffic, advanced rate limiting and analytics and developer key provisioning.


  • IBM to Acquire Netezza for $1.7 Billion

    IBM to Acquire Netezza for $1.7 Billion

    IBM announced it is acquiring Netezza at $27 per share or approximately $1.7 billion, to expand its business analytics initiatives.

    Netezza provides analytics in a data warehousing appliance. IBM says that the combined strengths of the companies are a "key differentiator at a time when organizations of all sizes are looking to gain more insight from their business information."


    The companies have already been strategic partners for years, with Netezza designing and developing its appliances on IBM systems technology.


    "IBM is bringing analytics to the masses," says Steve Mills, SVP and group executive at IBM Software and Systems.  "We continue to evolve our capabilities for systems integration, bringing together optimized hardware and software, in response to increasing demand for technology that delivers true business value."


    Netezza to be acquired by IBM"Netezza is a perfect example of this approach. Netezza strongly complements our business analytics capabilities and client base," he adds. " Together, we have the opportunity to quickly leverage the technology and accelerate the offering."


    IBM says it has over  6,000 consultants dedicated to analytics.  Over  the last four years, the company has invested over  $12 billion in 23 analytics-related acquisitions.


    Following the close of the acquisition, IBM intends to integrate Netezza within its Information Management software portfolio.  Netezza has approximately 500 employees around the world.


    The acquisition is subject to Netezza shareholder  and regulatory approval.


    Netezza is currently under investigation by a national securities firm led by a former federal judge, in connection with the proposed acquisition. The firm is investigating whether Netezza properly shopped the Company prior to entering into the agreement.