WebProNews

Tag: Nielsen

  • Disney/ABC and Nielsen Partner on Innovative TV Show iPad App

    Disney/ABC and Nielsen Partner on Innovative TV Show iPad App

    Disney/ABC and Nielsen have announced a new iPad app. The app is the first to be built on Nielsen’s new Media-Sync Platform, and uses audio watermarks to sync mobile devices to TV Programming. 

    The app is for the show "My Generation", and provides synced, interactive content, as well as social media functionality on the iPad. Users of the app will be able to automatically synce to any episode (live or time-shifted) of the series and access exclusive interactive content produced by ABC as a companion to that specific point in the episode. 

    Companion content will include things like polls, trivia, behind-the-scenes insights, production details and social networking features. The app will also allow consumers to interact with companion messages from sponsors.

    Clearly there is a lot of potential for this kind of thing moving forward, outside of this one app. 

    My Generation App

    "In the ever-evolving television landscape, we are constantly looking to create immersive viewing experiences around our shows," says Albert Cheng, executive vice president, digital media, Disney/ABC Television Group. "Together with Nielsen, we’ve created a sync-to-broadcast app that appeals to both fans and advertisers, and holds an array of possibilities for deeper engagement with our content and our advertisers’ brands."

    "The Media-Sync Platform was born out of Nielsen’s continuous investment in leading-edge audience measurement technologies and we believe it paves the way to fundamentally change the way consumers interact with TV programs and TV advertisements," says Sid Gorham, Nielsen’s EVP, Strategy and Business Development. "We are thrilled to collaborate with the innovative team at Disney/ABC to develop the first Media-Sync app and look forward to a broader industry wide launch in early 2011."

    The show itself starts Thursday, September 23, and the App is available in the App Store.

  • Interest For Smartphones Continues To Grow

    In their latest article, eMarketer highlights the growing interest of people to purchase smartphone. According to ChangeWave Research, and Nielsen expects smartphones to be in the hands of 50% of US mobile users by the end of Q3 2011

    eMarketer also details the most popular mobile application categories: Social media has shown the greatest growth over the last year (+240%), followed by weather, sports, banking and maps

    Comments

  • Bing Takes #2 Spot in Search, Even Without Yahoo’s Help

    Nielsen shared some new search market findings, indicating that Bing has overtaken Yahoo as the number two search engine in the U.S. for the first time. That’s MSN/Windows Live/Bing, to be more precise, which holds 13.9% of the market (as of August), according to the firm.

    Yahoo holds a 13.1% share, a decline from 14.6% in July. Google saw little change, but accounted for 65% of all U.S. searches. 

    The numbers do not take into account the Search Alliance between Microsoft and Yahoo, as Bing started officially powering Yahoo searches on August 24. Nielsen says, "If we combined Bing-powered search in August pro-forma, it would represent a 26% share of search."

    August Search Market Share according to Nielsen

    "In terms of a year-over-year comparison, Google has seen little change in its share of search while Yahoo! has seen a small but steady decline, going from a 16.0% share to 13.1% (a delta drop of 2.9% or a relative drop of 18%)," the firm says. "MSN/Windows Live/Bing’s share has grown from 10.7% in August 2009 to 13.9% (a delta increase of 3.2% or a relative increase of 30%)."

    Clearly, good things are happening for Bing, and with the Search Alliance firmly in place in the U.S. and Canada, with the international transition on the way, Bing’s numbers will be doing quite well going forward. Of course they still have a search partnership with Facebook and Windows Phone 7 sales to look forward to as well.

  • Why Are People Searching Less Than They Were a Year Ago?

    Nielsen released its version of the U.S. search market rankings for July this week. Google is of course on top with 3 out of 5 searches (64.2%). Yahoo came in second with 14.3%, leaving Microsoft in third at 13.6%.

    Yahoo and Microsoft both gained in month-over-month share (2% and 4%, respectively). This is all good for Microsoft, as Bing has now completely overtaken Yahoo’s organic results in the U.S. and Canada. We’ll see our first glimpse of how this is working out next month.

    Do you think Microsoft and Yahoo combined can take on Google? Share your thoughts.

    "In terms of a Year-on-Year comparison there has been little change in Google’s share but more significant movement amongst its closest competitors," says Nielsen. "MSN/Windows Live/Bing’s share has grown from 9.0% to 13.6% (a delta increase of 4.6% or a relative increase of 51%) while Yahoo!’s share has fallen from 17.1% to 14.3% (a delta drop of 2.8% or a relative drop of 17%). Consequently, over the last year Yahoo!’s delta lead over MSN/Windows Live/Bing has been reduced from 7.1% to only 0.7%."

    Nielsen July Search Stats - People Searching less in general?

    Google, Yahoo, and Microsoft account for more than 9 out of 10 searches (92.1%).

    The total number of searches in the U.S. over the last year has gone down by 16% from 10.5 billion to 8.8 billion. This is a very interesting stat. I wonder how much of this has to do with increased use of smartphones and mobile apps, taking the place of traditional searches. There are some other good points in the comments.

    Why do you think people are searching less? Comment here.

  • 70% of Global Online Consumers Watch Online Video

    This week, Nielsen released a new report on the global state of video consumption, finding that consumers all over the globe are adding screens to their media mix, as opposed to replacing them.

    The firm Google+Reader”>highlights the following findings:

    • Online Video: approximately 70% of global online consumers watch onlinhttps://www.dev.webpronews.comnode/55360/edite video; but North Americans and Europeans lag in adoption. More than half of global online consumers watch online video in the workplace.
    • Mobile Video: is already used by 11% of global online consumers: penetration is highest in Asia-Pacific and among consumers in their late 20s.
    • Tablet PCs: are expanding the definition of mobile video. Globally, 11% of online consumers already own or plan to purchase a tablet PC (such as an iPad) in the next year.
    • Nielsen Looks at Online VideoTelevision: is a universally important platform for video consumption, with connected consumers in many markets spending 4+ hours per day watching television.
    • HDTV (High-Definition TV): is improving the TV viewing experience for as many as 30% of global online consumers. Adoption is highest among older consumers and in North America, where HD content has proliferated.
    • 3DTV (Three-Dimensional TV): will have a small but important audience: 12% of global online consumers own or have definite intent to purchase a 3DTV in the next year.
    • “Over the Top” TV: televisions with Internet connections are gaining interest. About one in five (22%) global online consumers owns or has definite interest in buying a television with Internet connection in the next year.

    "This report provides one of the broadest looks at how consumers watch video, to date," says Matt O’Grady, who oversees the integration of Nielsen’s TV, online and mobile audience measurement. "The research reveals how connected consumers all over the world are expanding their video experience across screens."

    For the report, Nielsen surveyed 27,000 online consumers in 55 countries.

  • IBM Looks Into Accessible Mobile Interfaces, Google Giving up on Wave?

    IBM Looks Into Accessible Mobile Interfaces, Google Giving up on Wave?

    IBM has partnered with the Industrial Design Centre at the Indian Institute of Technology, Bombay on mobile web research. The initiative will focus on development of new designs of mobile device interfaces that can be used by people who are semiliterate or illiterate, as well as individuals who have limited or no access to information technology.

    Google appears to have somewhat given up on Wave, at least as a standalone product. The company posts to the Official Google Blog:

    We were equally jazzed about Google Wave internally, even though we weren’t quite sure how users would respond to this radically different kind of communication. The use cases we’ve seen show the power of this technology: sharing images and other media in real time; improving spell-checking by understanding not just an individual word, but also the context of each word; and enabling third-party developers to build new tools like consumer gadgets for travel, or robots to check code.

    But despite these wins, and numerous loyal fans, Wave has not seen the user adoption we would have liked. We don’t plan to continue developing Wave as a standalone product, but we will maintain the site at least through the end of the year and extend the technology for use in other Google projects. The central parts of the code, as well as the protocols that have driven many of Wave’s innovations, like drag-and-drop and character-by-character live typing, are already available as open source, so customers and partners can continue the innovation we began. In addition, we will work on tools so that users can easily “liberate” their content from Wave.

    Nielsen reports that the mobile Internet is more popular in China that it is in the U.S. "Widespread ownership of mobiles is only a fairly recent development in China, but consumers there have fully embraced the technology and in some ways are using it more robustly than their American and European counterparts," says Shan Phillips, Vice President, Greater China, Telecom Practice, The Nielsen Company.

    Nielsen also has another interesting report looking at who is buying the iPad, and asking if they will also buy an iPhone.

    iOS-user-profile

    WordPress has introduced its own "like" buttons. Now readers can "like" posts, although I’d say for publishers, the Facebook "like" buttons will be a lot more effective for driving traffic. Still, it’s nice to provide as many gateways for engagement as possible (without getting too cluttered, anyway).

    According to the Financial Times, Motorola and Verizon have teamed up on a "TV Tablet." This is a device with a 10-inch screen that users will be able to watch television on.

    Reuters reports that Sharp intends to launch a 3D smartphone this year. This would feature a 3D panel that can be viewed without special glasses and would have a 3D capable camera.

    According to Unwired Review, Samsung is considering puting touchscreen functionality on the back of a tablet. This is based on a patent application for a "mobile terminal having dual touch screen and method of controlling content therein".

    Meanwhile, as Engadget writes, Microsoft has been teasing an as-of-yet unannounced product via Twitter, saying, ""Don’t be so touchy…flat is where it’s at," and offering a small partial image of some object. This may or may not be a trackpad.

  • Americans Spending More Time On Facebook And Twitter

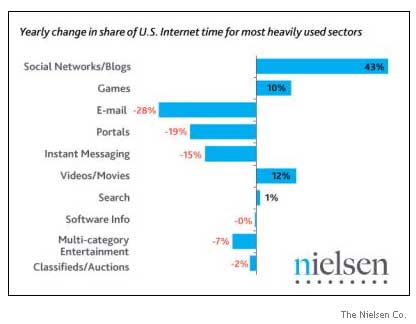
    Americans spend nearly a quarter of their time online on social networking sites such as Facebook and Twitter and blogs, up 15.8 percent from a year ago (43% increase) according to new research from Nielsen.

    The report called "What Americans Do Online," found that Americans spend a third of their online time (36%) communicating across social networks, blogs, email and instant messaging.

    Online games surpassed email to become the second most heavily used activity behind social networks, accounting for 10 percent of all U.S. Internet time. Email decreased from 11.5 percent of time to 8.3 percent.

    Nielsen-Social-Networking

    Among the most heavily used categories, videos/movies was the only other to experience a significant growth in share of U.S. activity online. June 2010 was a major milestone for US online video as the number of videos streamed passed the 10 billion mark. The average American consumer streaming online video spent 3 hours 15 minutes doing so during the month.

    Social networking has not yet pushed email and instant messaging into obscurity yet. Both saw double-digit declines in share of time, email remains the third heaviest activity online (8.3% share of time) while instant messaging is fifth, accounting for four percent of Americans time online.

    "Despite the almost unlimited nature of what you can do on the web, 40 percent of US online time is spent on just three activities – social networking, playing games and emailing leaving a whole lot of other sectors fighting for a declining share of the online pie," said Nielsen analyst Dave Martin.

    The way consumers spend their online time on their mobile phones is slightly different than their Internet use on computers.  There is a double-digit (28%) increase in the use of social networks,  but email activity via mobile devices continues to increase from 37.4 percent to 41.6 percent of U.S. mobile Internet time.

    Portals remain as the second heaviest activity on mobile Internet (11.6 percent share of time), despite their double digit decline and social networking’s rise to account for 10.5 percent share means the gap is much smaller than a year ago (14.3 percent vs. 8.3 percent).

    Other mobile Internet activities seeing significant growth include music and video/movies, both seeing 20 percent plus increases in share of activity year over year. As these destinations gain share, it’s at the cost of other content consumption – both news/current events and sports destinations saw more than a 20 percent drop in share of US mobile Internet time.

    "Although we see similar characteristics amongst pc and mobile internet use, the way their activity is allocated is still pretty contrasting, added Martin. 

    "While convergence will continue, the unique characteristics of computers and mobiles, both in their features and when and where they are used mean that mobile Internet behavior mirroring its PC counterpart is still some way off."


  • Finding Alternatives To Facebook

    Finding Alternatives To Facebook

    With the news confirmed that Facebook membership now exceeds 500 million people worldwide – that’s nearly 10 percent of the world’s total population – it’s a worthy reminder to note that, never mind its size or seeming monolithic ubiquity, there are other social networking places to complement Facebook.

    The BBC has produced an attractive visual display on the rise and fall of social networks using metrics from market researcher Nielsen in June as its source.

    As the chart here on the top five social networks by country shows, Facebook dominates in six of the seven countries the BBC highlights – USA, Australia, Germany, UK, Spain and Italy. The difference in Brazil, where Orkut is the leader with Facebook a distant second.

    Yet even as Facebook is king, and not even well liked in some countries, look at the other social networks. In Germany, for instance, 8.5 million people are members of VZNet Netzwerke which includes StudiVZ, the big network for young people. In Spain, 6.6 million are with Tuenti. Brazil, too, where 5.9 million are in iG Comunidades. And let’s not forget MySpace (which recently underwent a facelift) – it’s in second place in the USA, UK, Australia and Italy and third in Spain.

    My point is simply a reminder that, from a business perspective in particular – notably, if you’re planning any kind of outreach or engagement activity in these countries – recognize that the dominant social network isn’t necessarily the only place where your engagees spend their time and exercise their influence – sizeable niche communities are elsewhere too.

    Comments

  • Nielsen Puts Both Yahoo, Bing Up In May

    Right on schedule, Nielsen’s provided another look at the U.S. search market, and although absolutely nothing changed at the top – Google’s market share didn’t fluctuate at all between April to May – something interesting did occur last month as Yahoo and Bing gained ground.

    YahooHere’s a little bit of historical info in case past stats don’t come straight to mind: ever since Microsoft and Yahoo first announced their partnership, there’s been a fairly steady tradeoff in market share between them.  Which is a bad thing from both companies’ perspectives, since it implies Microsoft’s paying for technology it doesn’t need.

    Nielsen’s data covering May indicates the companies each have something to bring to the table, however.

    Nielsen determined that Yahoo managed to increase its market share by 0.3 percent on a month-over-month basis, and Bing increased its share by 0.1 percent.  That left the two organizations with market shares of 13.8 percent and 13.0 percent, respectively.

    Bing logoSo now Yahoo and Bing are a tiny bit closer to Google (with its market share of 65.1 percent), and have put more distance between them and fourth-place AOL.  (AOL was in fact the big loser in May, getting left with a market share of 2.1 percent after seeing its standing drop 0.4 percent.)

    It’ll be very interesting to see if Yahoo and Bing can sustain this growth.  For that matter, even continuing to hold Google back would count as an accomplishment.

  • Social Media Accounts For 22% Of Time Spent Online

    The Web is a vastly more social place now than it was a year ago, according to new data from Nielsen.  Double-digit growth occurred in a couple of categories, and at this point, Nielsen believes an impressive 22 percent of all time spent online is spent perusing social networks and/or blogs.

    Actually, that figure may be even larger for June; Nielsen’s latest stats are from April (and so the year-to-year comparison was made with April 2009).  But in any event, a lot has changed, and Nielsen described the differences this afternoon with a paragraph full of percentages.

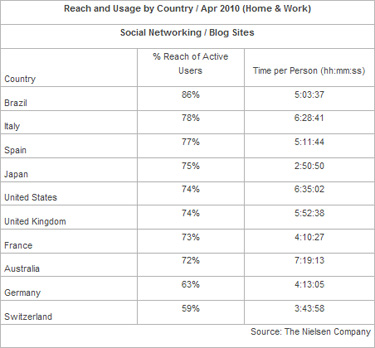
    Nielsen reported, "[T]he world now spends over 110 billion minutes on social networks and blog sites. . . .  For the first time ever, social network or blog sites are visited by three quarters of global consumers who go online, after the numbers of people visiting these sites increased by 24% over last year.  The average visitor spends 66% more time on these sites than a year ago, almost 6 hours in April 2010 versus 3 hours, 31 minutes last year."

    Then if you’re curious how social people are on a nation-to-nation basis, the chart below provides a little insight.

    These figures are obviously all very encouraging for organizations like Facebook, YouTube, and Twitter.

  • Broadband Continues To Drive Online Video Viewing

    High definition television, DVRs, and the Internet are creating higher quality and better experiences for consumers, leading to an increase in the amount of videos Americans watch, according to a new Nielsen Three Screen Report.

    "Consumers are driven by the convenience and quality that today’s technology now enables," said Matt O’Grady, Executive Vice President, Audience Measurement, Nielsen.

    "New mobile devices and enhanced TV quality allow viewers to engage in more content than ever before."

    More than half of U.S. TV households now have HDTV, up 189 percent from the first quarter of 2008, and more than one-third have DVRs, up 51 percent. High-speed broadband access, now in 63.5 percent of homes, has created a better user experience for watching online videos and nearly a quarter of households have smartphones, allowing people to "place shift" and watch video anywhere.

    Nielsen-Three-Screen-Report

    Despite the common perception that viewers of videos on mobile phones are mostly teens, more than half (55%) are adults aged 25-49. While mobile online video viewing is still fairly limited, year over year growth is notable at 51.2%.

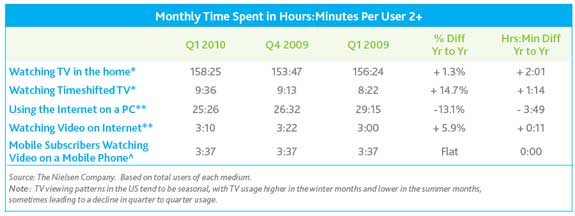
    TV is still the most popular screen of choice: viewers watched 2 more hours of TV per month in the first quarter of 2010 compared to the same period a year prior (158:25 vs. 156:24).  They are also continuing to simultaneously use the Internet while watching TV, with the average time spent doing both activities up 9.8% to 3 hours and 41 minutes.

    AS of the first quarter of 2010 the 292 million people in the U.S. with TV spend on average 158 hours, 25 minutes each month watching television. Also in the first quarter 138 million people watched video on the Internet spending on average 3 hours, 10 minutes.

    When it comes to mobile video, 20.3 million watched mobile video in the U.S., spending on average 3 hours and 37 minutes each month.


  • Facebook, Twitter Maintain Impressive Momentum

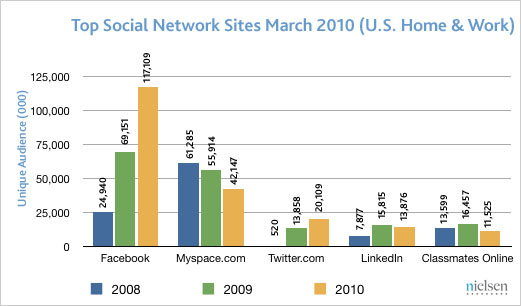
    Facebook and Twitter continue to chalk up impressive gains in terms of attracting unique audiences.  A new report from Nielsen frames their growth on a year-over-year basis, and the two social networks have managed to achieve increases of 69 percent and 45 percent, respectively.

    Those figures are impressive enough on their own, and by chewing them over, it might be possible to delve into lengthy discussions about growth patterns and potential revenue.  But what’s also interesting is that Facebook and Twitter appear to be driving the success of social networks as a whole.

    Nielsen found that the unique audience of social networking sites increased between March of 2008 and March of 2009 (from 261.7 million to 313.7 million), and that the time spent per person almost doubled (from about 3 hours and 33 minutes to 6 hours).

    Look at the graph below, though, and you’ll see that top social sites other than Facebook and Twitter aren’t doing so hot in terms of winning over new users (or even keeping the old ones coming back).

    To return to the theoretical discussion about growth patterns and potential revenue: you can almost be sure Facebook and Twitter’s IT and advertising teams will receive copies of this report.

  • Americans Increase Use Of Internet And TV Together

    Americans upped their overall media usage and multitasking in the fourth quarter of 2009, according to Nielsen’s latest Three Screen Report.

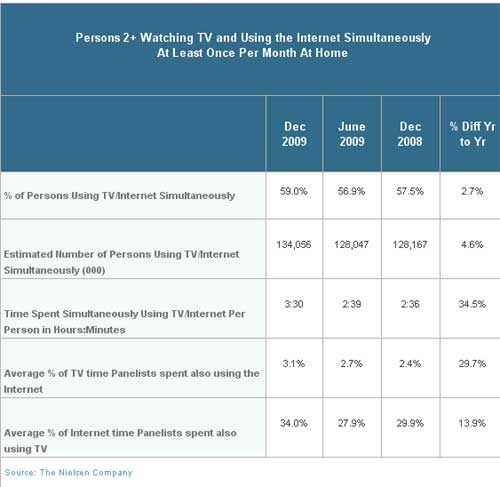
    In the last quarter of 2009, simultaneous use of the Internet while watching TV reached three and a half hours a month, up 35 percent from the previous quarter. Nearly 60 percent of TV viewers now use the Internet once a month while watching TV.

    "The rise in simultaneous use of the web and TV gives the viewer a unique on-screen and off-screen relationship with TV programming," said Nielsen Company media product leader Matt O’Grady.

    TV-&-Internet

    "The initial fear was that Internet and mobile video and entertainment would slowly cannibalize traditional TV viewing, but the steady trend of increased TV viewership alongside expanded simultaneous usage argues something quite different."

    Online video viewing is up 16 percent from last year. Nielsen says 44 percent of all online video is being viewed in the workplace. Americans watch network programs online when they miss an episode or when a TV is not available. Online video is used similarly to a DVR and not typically a replacement for watching TV.

    Active mobile users increased by 57 percent from the fourth quarter of 2008 to the fourth quarter of 2009, from 11.2 million to 17.6 million. Much of the increase is due to the strong growth of smartphones.

    "It seems that, for the foreseeable future at least, America’s love affair with the TV will continue unabashed," said O’Grady.

    "We seem to have an almost insatiable appetite for media, with online and mobile programming only adding to it."


  • Nielsen: Time Spent On Social Networks Up ~60% YOY

    Facebook, MySpace, Twitter, LinkedIn, and other such sites are – in general, anyway – doing quite well on a global basis, according to new stats from Nielsen.  Nielsen revealed this afternoon that people all over the world are dedicating a lot more time to social networks.

    A report stated, "On average, global web users across 10 countries spent roughly five and a half hours on social networks in February 2010, up more than two hours from the same time last year."  Italians and Australians actually took the lead, too, beating the U.S. average of 6 hours and 3 minutes by 25 minutes and 22 minutes, respectively.

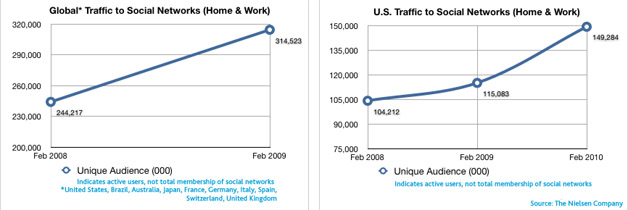
    Then here are a couple more interesting findings: "Overall, the active unique audience to social networks grew nearly 30%, from 244.2M to 314.5M in the last year.  In the U.S., the average active unique audience grew to 149.M from 115M in February 2009" (which also works out to 30 percent).

    Facebook made Nielsen’s last points of comparison anything but close calls, though.  It beat the other social networks by wide margins in terms of "% Reach of Active Social Users," "Sessions per Person," and "Time per Person."

    Facebook, then, would appear best positioned to find advertisers and generate revenue outside the U.S.

  • Nielsen: Online Video Usage Significantly Up YOY

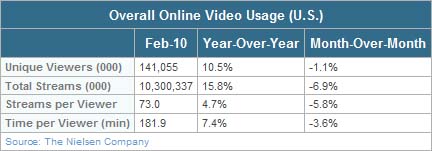
    Glass-half-full and glass-half-empty types, prepare to be split.  New stats from Nielsen indicate that February of 2010 was a great month for the online video industry compared to February of 2009.  Last month was a little bit rotten compared to January of 2010, however.

    The chart below shows how the big-picture data categories played out.  "Unique Viewers" and "Total Streams" made the most progress year-over-year, even as "Total Streams" and "Streams per Viewer" slipped the most month-over-month.  You’ll see the YOY gains are generally bigger than the MOM losses, at least.

    As for how some specific brands performed between January and February, YouTube lost ground in terms of unique viewers, video streams, and time spent per viewer (-3.4 percent, -10.7, and -3.6 percent, respectively).  Hulu only slid in terms of unique viewers (-7.4 percent), while making small increases elsewhere.

    At the same time, Facebook pulled in some more unique viewers (4.7 percent), and is actually coming somewhat close to matching Yahoo in this category.  Also, the CNN Digital Network and Microsoft’s sites racked up big gains on the unique viewers and video streams fronts (20+ percent in both cases).

    Finally, on a somewhat related note, WebProNews will be generating some video of our own as we’re in Austin to cover SXSW.  Look for live video in addition to our traditional recorded coverage.

  • Don’t Count Out Facebook as a Competitor to Google

    In case you were wondering, Facebook is pretty popular. Google is of course the undisputed king of search market share, but Facebook has the edge in some areas. Social media is the obvious area.  While Google is hoping to make some serious headway here with Buzz, Facebook is far and away the dominant being in the world of social networks.

    Compete shared some data with us that emphasizes just how big Facebook is, and just how seriously it should be taken. If these stats from Facebook weren’t enough for you, Compete points out that Facebook has surpassed Yahoo as the #2 site online in the U.S. in terms of unique visitors, just under Google.

    In December, according to Compete, Facebook’s unique visitors in the U.S. had increased by over 121%. That’s pretty incredible, because I seem to recall Facebook being pretty popular in late 2008 too.
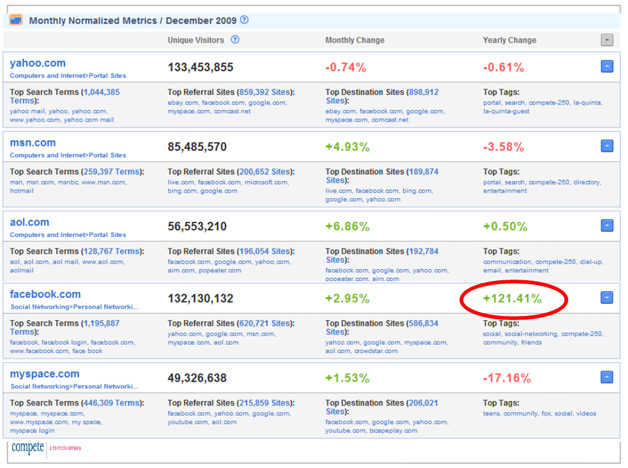
    Unique Visitors in December

    In terms of social media sites, none of the others even come close in the U.S. – not even the world’s second largest search engine, YouTube: 

    So Facebook is already bigger than the second largest search engine. Add to that, the fact that search on Facebook itself is rising. According to comScore, Facebook’s search query percentage increased by 13% from December to January, growing to 395 million searches:
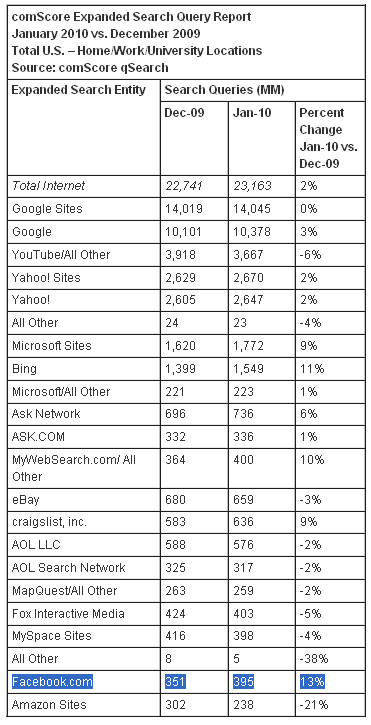
    Search Query Report

    Greg Sterling notes, the numbers in the chart "are likely internal searches on Facebook for content or friends, rather than web search. This is not the same thing as people conducting searches on Google, Yahoo or Bing more generally. And 13 percent growth is certainly strong, but not "phenomenal.’"

    Facebook’s search feature, which has been emphasized somewhat with the latest redesign, lets users search people, pages, groups, apps, events, posts by friends, posts by everyone, OR web results. Sterling makes the case that internal Facebook searches are different from web searches one would perform on Google, but in some ways, Facebook search simply goes places that Google doesn’t (while also going Places that Google does via the Bing-powered web search).

    Facebook is almost like its own web in some ways, and that is becoming truer all the time as Facebook gets more of users’ time spent online (which it is doing through status updates, news, apps/games, videos, music, events, and possibly email in the future…we also suggest Facebook consider adding blogging to the mix).

    Look at this newly released data from Nielsen about time spent online. In January (in the U.S.), Facebook users averaged 7 hours a month on the site. As a point of comparison, Google users spent about 2 hours.
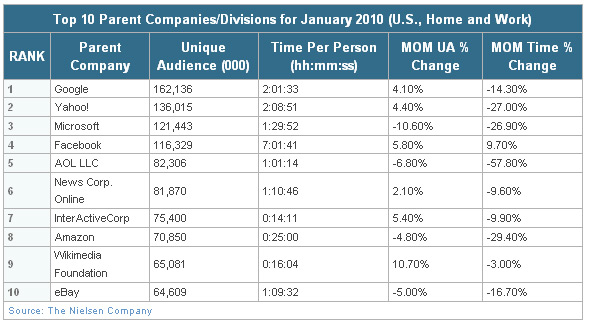
    Hours spent online

    In some ways, that doesn’t really take anything away from Google, because Google’s job as a search engine is to get you where you need to be to find what you’re looking for. However, Facebook users appear to be finding plenty of stuff they are looking for along with stuff they didn’t know they were looking for, as well as just hanging out and being entertained. With Facebook’s search feature, they’re able to find what they’re looking for without having to leave Facebook until the search result (at least theoretically).

    Whether you think Facebook’s search growth is "phenomenal" or not, you can’t overlook the fact that more people are using the search feature, and some unknown percentage of that is pulling from Bing. Maybe this should be construed as a good reason not to overlook your Bing SEO efforts. Maybe it’s also another reason why Facebook should be viewed as one of Google’s key competitors (along with Microsoft, Yahoo, and increasingly Apple).  Actually, Sterling points out that Google recently listed Facebook officially as a competitor for the first time in its annual 10K filing.

    Google is seemingly going after the market that Facebook dominates with the launch of Google Buzz, but status updates are just part of the big picture. Search is just part of the big picture. It’s all about getting the user’s attention, is it not? Here are some tips for running a good Facebook page.

    What do you think? Discuss here.
  • Consumers More Likely To Pay For Professional Online Content

    Not surprisingly, the majority (85%) of online consumers prefer free content, but some categories they would be willing to consider paying for access, according to a new survey from Nielsen.

    Nielsen asked more than 27,000 consumers across 52 countries about what types of online content they would be willing to pay for. The survey found consumers are most likely to pay for online content they would pay for offline including movies, music, games, and television shows.

    Consumers are least likely to pay for content on social networks, podcasts, consumer-generated videos and blogs.

    Paying-for-content

    The survey found consumers worldwide generally agree that online content will have to meet certain guidelines before they spend money to access it:

        *Better than three out of every four survey participants (78%) believe if they already subscribe to a newspaper, magazine, radio or television service they should be able to use its online content for free.
       

     *At the same time, 71% of global consumers say online content of any kind will have to be considerably better than what is currently free before they will pay for it.
       

    *Nearly eight out of every ten (79%) would no longer use a web site that charges them, presuming they can find the same information at no cost.
       

    *As a group, they are ambivalent about whether the quality of online content would suffer if companies could not charge for it-34% think so while 30% do not; and the remaining 36% have no firm opinion.
       

    *But they are far more united (62%) in their conviction that once they purchase content, it should be theirs to copy or share with whomever they want.


  • Nielsen Grants Bing Small Win Against Google

    We heard earlier this week from comScore and Hitwise, and today, still more evidence that Bing performed well in January arrived.  Nielsen has released its monthly report regarding the U.S. search market, and according to the firm, Bing managed to increase its market share by exactly 1.0 percent.

    Bing logoIn December, Bing’s market share was a slightly embarrassing 9.9 percent.  But Nielsen indicated this afternoon that it’s cracked the 10.0 mark, landing at 10.9 percent in January.  Which isn’t a bad achievement for a single month.

    What makes Bing’s accomplishment much more impressive is that Microsoft seems to have drawn searchers away from Google, too.  On a month-to-month basis, Google’s market share decreased from 67.3 percent to 66.3 percent, according to Nielsen.

    Meanwhile, Yahoo gained just the tiniest bit of ground, inching up from a share of 14.4 percent to 14.5 percent.

    As always, it’ll be interesting to see if these changes are the start of any sort of trend, or just one-time adjustments.  A big factor in how things play out this month will probably be how the search engines handle scores, medal counts, and athlete profiles relating to the Olympics.

  • Online TV Shows May Get More Ad-Heavy

    Online TV Shows May Get More Ad-Heavy

    For the most part, online video has been much less ad-heavy than television programming. It is this very fact that has likely been a large part of the medium’s popularity. Things may be changing, however.

    According to Advertising Age, Nielsen is planning on making data available about the viewing of commercials that run in particular shows , whether they are viewed on TV or online. The data would start being available in September, and the publication says it will become the basis for ad negotiations next February.

    "But here’s the catch: For Nielsen to be able to provide the commercial rating, shows seen online will have to have the same group of commercials that run on TV," says AdAge’s Brian Steinberg. "If this system were adopted en masse — and it’s not clear that it would be — online viewing might be crammed just as full of commercials as the more traditional TV-watching experience."

    "Indeed, viewing programs on Hulu, the online video site owned by NBC Universal, News Corp. and Walt Disney, means encountering significantly fewer ads than one would see watching TV. And Disney’s ABC.com has met with some success by running ABC shows with just a few ads, often from a single advertiser," he adds. "But many TV executives say these methods don’t bring much, if any, profit — and therefore cannot continue."

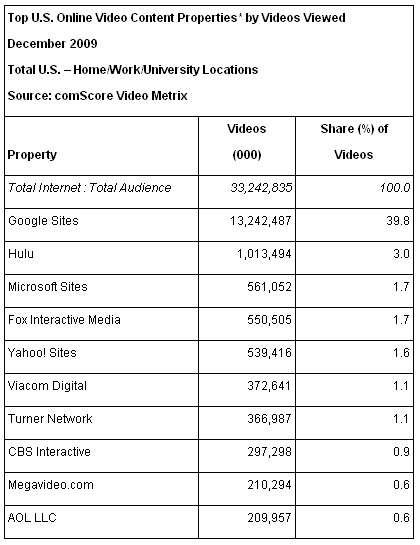
    Online video has enjoyed tremendous growth over the last several years. In December, 178 million Americans watched 33 billion videos online, according to data from comScore. About 40% of that was at Google sites (like YouTube). The second largest amount of market share went to Hulu, at just 3%.

    Online Videos in December

    YouTube isn’t necessarily the place people go to watch full episodes of television shows. Hulu is. If videos at sites like Hulu become more ad-heavy, the market share gap could just increase even greater. It could also have an impact on both paid TV show downloads and piracy.
     

    Related Articles:

    > Google To Get More Interactive With Mobile Video Ads

    > IAB Releases Ad Unit Guidelines Updates

    > YouTube Videos In Adsense Could Drive Clicks

  • Super Bowl Viewers Spend Game Time on the Web

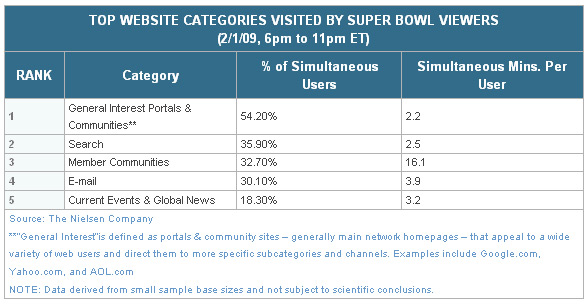
    Last year, 12% of Super Bowl viewers used the Internet while watching the game according to data from Nielsen. Those that used the web spent an average of 24 minutes online during the game. It would not be at all surprising if those numbers increased significnatly this year.

    "Nielsen found that simultaneous users were most engaged in general interest, e-mail, and online social networks," the firm says. "Sports sites, which might be more directly associated with the game itself, were visited by 18% of simultaneous users."

    Super Bowl Web Usage

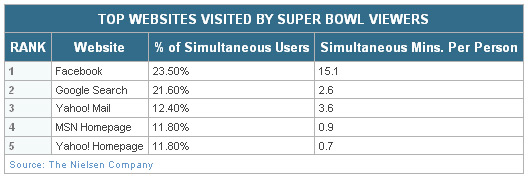
    According to Nielsen, about a quarter of simultaneous users spent time during the game using Facebook at an average of 15 minutes. Google and Yahoo Mail also received significant use during game time.

    Super Bowl Web Usage

    The game takes place this evening of course. Will you be watching? Will you be watching and using the web? How do yo plan on using the web during the Super Bowl?

    Related Articles:

    > GoDaddy Back in the News for Super Bowl Ads

    > Vote For Your Favorite Super Bowl Ads Online

    > Pepsi To Skip Super Bowl For Social Media

  • 178 Million Americans Watched 33 Billion Online Videos in a Month

    Research firm comScore has just released data about the U.S. online video market from December. Americans reportedly watched 33.2 billion videos online during that month. 178 million users watched video online.

    Google sites ranked at the top of the list by a significant margin, just like usual. Hulu was next in line with about a 12 million video difference. Google sites accounted for nearly 40% of the market share, with Hulu accounting for 3%. Here’s the top ten:

    Online Videos in December

    *Rankings based on video content sites; excludes video server networks. Online video includes both streaming and progressive download video.

    According to comScore, users watched an average of 187 videos per viewer in December. That works out to be roughly 6 a day.

    "Google Sites attracted 135.8 million unique viewers during the month (97.5 videos per viewer), followed by Yahoo Sites with 59.8 million viewers (9.0 videos per viewer) and Fox Interactive Media with 56.8 million viewers (9.7 videos per viewer)," comScore says. "The average Hulu viewer watched 22.9 videos during the month, representing another all-time high for the property."

    The top video ad networks in terms of their actual reach delivered were: Tremor Media Video Network with 30.5% penetration of online video viewers, BrightRoll Video Network with 21.7%, and BBE with 21.2%.

    86.5% of the total U.S. Internet audience viewed online video. 134.4 million viewers watched over 13 billion videos on YouTube.com (97.1 videos per viewer). 44.9 million viewers watched 423.3 million videos on MySpace Sites (9.4 videos per viewer). The average Hulu viewer watched 22.9 videos, totaling 2.2 hours of videos per viewer. The duration of the average online video was 4.1 minutes.
     

    Related Articles:

    > Google To Get More Interactive With Mobile Video Ads

    > IAB Releases Ad Unit Guidelines Updates

    > YouTube Videos In Adsense Could Drive Clicks