To hear Google tell it, Google+ is growing into a major social network that will soon rival Facebook. The company loves to point out that more brands are adopting the social network and that the site now has over 170 million users. The question is, how many of those users actually participate in the social network by making posts or marking things with a +1? According to a new study from RJ Metrics, user engagement on Google+ is abysmal.
The study was conducted by downloading the public timelines of 40,000 random Google+ users. Of that number, only one-third of them even had any public activity. Of that one-third, the statistics don’t paint a pretty picture. The study looks at how much users post, how frequently users post, and how much attention the average post gets.
 Google+ posts” />
The chart above shows how likely users are to make another post given the number of posts they have already made. For example, a user who only has one post has about a 70% chance to make another, after which he or she has around a 76% chance to post another, and so on. The chart may seem to show good numbers for Google+, with users becoming progressively hooked the more they post. The study author points out, however, that in charts of other social networks these percentages usually quickly climb to over 90%.
 Google+ posts” />
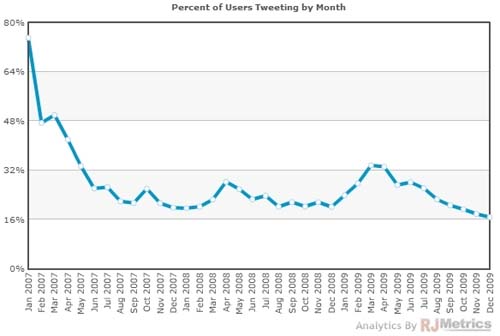
This next cohort analysis chart shows the average monthly posts by a Google+ member as time goes on. The colors represent the month during which a user joined the social network. Though the average is still rising slightly, the declining rate in the average number of posts shows that user engagement is waning. This chart is very different from other cohort analysis charts for different social networks. The study points out, for example, a similar chart regarding Pinterest, seen below, which shows that platforms’ wild upsurge in popularity. Google+, which is slightly younger than Pinterest, shows no such surge, even at its outset.
 Pinterest cohort study” />
The last graph provided by the study shows just how long Google+ users go between posting content. Users with only two posts average two postings per month and, despite more postings, the graph quickly averages out to around 11 days between postings. The study states that the overall average amount of time between postings is 12 days.
 Google+ posts” />
Users on Google+ may be hesitant to post much content because their posts do not garner much attention. The study reveals that the average number of +1’s on a post in under 1, at 0.77. Post replies and re-shares are even lower, at 0.54 and 0.17 per post, respectively. Most users might as well be talking to themselves.
So why does Google+ have so many members who don’t participate in the community? The answer may lie in how Google recruits users to its social network. The company has begun to integrate Google+ into every facet of its business. From Picasa to Google News, Google+ integration is becoming ubiquitous in Google products. This doesn’t sit well with all Google users (Wil Wheaton for example), who don’t want their useful Google products tied to a catatonic social network.
Since Google+ is so integrated with Google, any person with a Google account automatically has access to Google+, so pure curiosity might explain the social network’s rising membership numbers. Many Google users must log it to see what the platform is and does, only to find it empty and never log in again. Another reason for the poor engagement could be members who don’t post, yet use some of the tools Google+ provides, such as its much-touted Hangouts.
Though Google+ is not in any shape to seriously compete with Facebook, some niche communities have found Google+ useful. The large amount of storage that Google+ integration give Picasa makes the platform perfect for the photography community. Also, many members of the tech community find the network a good place to connect with like-minded people while avoiding the bustle and noise of other social networks. For the most part, though, Google+ members simply don’t share much at all.
(RJ Metrics via Fast Company)
 Google+ posts” />
 Google+ posts” />
 Pinterest cohort study” />
 Google+ posts” />