WebProNews

Tag: Nielsen

  • Top TV Ads of 2011 According to Nielsen

    Nielsen has released a few top ten lists for the top TV ads of the year.

    The top most-liked new ad was from Volkswagen, and its Passat ad featuring a little boy dressed as Darth Vader.

    Here’s a look at the whole list:

    Nielsen top ads

    The top most-remembered branded integration with a drama/sitcom was Purell and The Big Bang Theory from October 27, where Sheldon uses hand sanitizer after he puts a live snake into a desk drawer. Here’s that top ten list:

    top ads

    Finally, the top primetime program with product placement activity was American Idol, with 577 occurrences.

    top ads

    What was your favorite TV ad of the year? Let us know in the comments.

  • Why Facebook Users Add And Delete Friends [Infographic]

    NM Incite, a Nielsen McKinsey company, has put out the following infographic looking at why Facebook users add and remove friends.

    The top reason for adding a friend, according to their survey of nearly 2,000 adults, is knowing them in real life. Makes sense. The other reasons are interesting: 60% for mutual friends, 11% for business networks, 8% for physical attractiveness, 7% for increasing friend count (lame), 7% for friending everyone (lame), 7% for quality of photo, and 4% for their number of friends.

    The top reason for removal is offensive comments. This is followed by: don’t know well (41%), trying to sell me something (39%), depressing comments (23%), lacking interaction (20%), political comments (14%), breakup/divorce (11%), don’t like their friends (8%), update profile too often (6%), they add too many people (6%), they don’t update enough (3%).

    facebook friends and deletions

    What’s your top reason for adding a friend? Removing a friend? Let us know in the comments.

  • Nielsen Study: Teen Mobile Data Usage Up Over 250%

    Nielsen has released the results of a study into mobile phone usage by various age groups. While the study shows a rise in data usage across the board, the greatest increase was in the 13-17 age group. In the third quarter of 2010, teens in this group used an average of 90 MB of data per month. In this year’s third quarter they used a whopping 320 MB of data, a rise of 256%. While the increase was most dramatic among teens, every age group showed an increase. The next greatest increase was 147% in the 18-24 age bracket. Only one group – the 45-54 age bracket – showed an increase of less than 100%.

    Data usage across age groups

    The use of text messaging is highest among teens – particularly female teens – as well. Teens sent an average of 3,417 SMS/MMS messages per month in the third quarter of this year, with girls sending an average of nearly 200 more messages than boys.

    Messaging across age groups

    Interestingly, voice usage is actually down among teens, who say they find messaging faster, easier, and more fun that voice calling. The study shows they used an average of just over 100 fewer minutes this year than in the same period last year.

    These results are part of Nielsen’s broader State of the Media: The Mobile Media Report Q3 2011 (PDF). Another part of the study focused on smartphone ownership and app usage across various age groups. They found that the majority of people in the 18-24 (53%) and 24-34 (64%) age groups owned smartphones. Meanwhile 40% of the 13-17 age group owned smartphones, a number which surely contributed to the dramatic increase in data usage in the same age bracket. The study also found and that 62% of smartphone owners had downloaded apps within the past 30 days.

  • YouTube Comes to Xbox

    YouTube Comes to Xbox

    YouTube formally announced its Xbox 360 app today. With the app, users can check out trending videos, browse categories, and of course search for videos. Here are some videos they shared to accompany the announcement:

    I think it goes without saying that having YouTube on Xbox is going to be pretty big for driving video views on the console.

    Nielsen says streaming video on game consoles is up over last year. The firm just put out results from an October survey on the topic. Here’s a look at that:

    Videos on consoles

    “Streaming now represents a reported 14 percent of Xbox 360 time, 15 percent of PS3 time and 33 percent of Wii time. This growth is fueled by the availability of services like Netflix, Hulu, MLB Network and ESPN3,” it says.

    How do you think the YouTube app will affect that on Xbox?

    Here’s a particularly timely infographic about YouTube facts from social-media-training.co.uk:

  • The Most Popular Android Apps: Facebook Dominates Across Ages

    Nielsen has released the results of a survey looking at the most popular apps on Android. The survey is broken up into three age segments: 18-24, 25-34 and 35-44.

    It shouldn’t come as much of a surprise that Facebook dominates. And that’s across each age group surveyed. It’s certainly worth noting that Facebook is beating Google’s own products on its own operating system.

    It beats out Google Search, Gmail, Google Maps and YouTube (and yes, Google+), according to Nielsen’s numbers, though it does fall behind Google’s Android Market. Here’s how things shook out:

    Top Android Apps

    Facebook has obviously become a force to be reckoned with for any Internet company in terms of where users are spending their time online (including mobile). Facebook is also the top free app of the year in Apple’s App Store.

    It really says something about Facebook’s power when it dominates Android use so much, even though Facebook’s Android app has been very buggy and often complained about. Facebook just finally released a new, better version of the app. It also says something about the trend of how people are consuming information.

    “Apart from gaming, the 35-44 segment demonstrates a greater inclination to shop using the Amazon AppStore: 24 percent of them used the app in the last 30 days, while only 14 percent of those 18-24 did the same,” says Nielsen. “Groupon appeals more to those 25-34, not even making the top 20 ranking for those 18-24. A similar trend was found on Google+: active reach was higher for those 25 and older when compared to the 18-24 demographic.”

    Nielsen ranked the apps by active reach, using percentage of Android owners who used the app within the past 30 days.

  • Modern Warfare 3: It’s What You Want For Christmas

    It’s almost October, which means that everyone is already gearing up for the big holiday shopping season. One of the biggest elements to any holiday shopping season since the mid 80’s is games, and this year looks like it will not disappoint when it comes to available titles.

    Nielsen has put out their Top 20 Games to Watch for Holiday 2011 list, and it looks like the boys at Activision have to most coveted game of the season.

    The latest edition to the Call of Duty Series, Modern Warfare 3 is the most wanted game of the holidays.

    Nielsen surveyed 5,000 active gamers in August and September about which games (released between August and November) they are most likely to purchase this holiday season. They then ranked the titles based on how many people surveyed put it in their top 5. Leading the way with 27% appearance in tops 5s was Modern Warfare 3. Gears of War 3 and Madden NFL 12 tied for second place with 19% of people putting it in their top 5.

    It’s definitely interesting to see Battlefield 3 all the way down at the 7 spot with 12%. There’s been a significant amount of internet buzz surrounding this game and the gameplay trailers look absolutely incredible.

    It’s also important to note that there is only one game in the top 20 that isn’t part of a franchise. Dead Island is the only standalone game that falls on the most-wanted list. We learned recently that Lionsgate has optioned the rights for a Dead Island film based mostly on the award-winning trailer.

    Part of the Nielsen data included impressions from 417 million online conversations. These were used to show what, specifically, gamers were excited about when it comes to each title. For instance, most people are excited about new villains when it comes to Batman: Arkham City, and most Madden NFL 12’ers are planning on calling in sick to work to play the game.

  • In a Month, Americans Collectively Spend a Century on Facebook

    Nielsen has just released their Q3 2011 Social Media Report, and there are some incredibly interesting statistics included in the findings.

    On the whole social media (blogs included) is a part of 80% of internet users’ lives. And people aren’t just members of social networking sites, but they are interacting with them…constantly. Apparently, 23% of an American’s time spent on the internet is spent on social media. That’s almost a quarter of the time – more than double the next category of time-occupiers, which is online gaming (9.8%).

    The social media study also looked at the most active social networker and found that to be a woman. This average social media user is between the ages of 18 and 34. She lives in New England, and is likely of Asian or Pacific Island descent. She has most likely obtained a bachelor’s degree and probably makes under $50,000 a year.

    The most mind-blowing stat from the study concerns the amount of time people actually spend on these social sites.  Nielsen looked at minutes spent, collectively, by Americans in one month.  According to the statistics, we spend 53,457,258 minutes, as a population, on Facebook.    That’s almost 102 years.  We don’t even spend a fraction of the amount of time on other sites like Twitter and LinkedIn.

    Here are some other finds from the study –

    • 37% of social media users access the platforms via mobile device
    • As far the most valued services on their mobile devices, people picked social media access as number two, behind GPS
    • Social networking apps are the third most popular apps, behind games and weather
    • Over twice as many people 55 and older used the mobile device to access social media as did last year
    • When you post a video to Facebook, women are more likely to watch but men are more likely to watch longer
    • Social networkers are 47% more likely than other internet users to spend a lot of money on online shopping
    • Australians spend the most time on social networks and blogs
  • 40% of Mobile Users Use Smartphones, 40% of Them Use Android [US]

    Nielsen released a new report today indicating that 40% of mobile users in the U.S. own smartphones and 40% of those are Android devices. That’s consumers over the age of 18.

    iOS devices, the firm reports, are in second place with 28%.

    “Among those who say they are likely to get a new smartphone in the next year, approximately one third say they want their next smartphone to be an iPhone and one third say they want an Android device,” says Don Kellogg, Director of Telecom Research and Insights at Nielsen. “However, among those who say they are usually the first to embrace new technologies, “Innovators” or the earliest of early adopters, Android leads as the “Next Desired Operating System” – 40 percent for Android compared to 32 percent for iOS. (Survey respondents were asked several questions to determine their attitudes toward new technologies.)”

    Nielsen report

    “Among likely smartphone upgraders, it is the ‘Late Adopters’ who are most likely to say they are ‘not sure’ which operating system they’d like in their next smartphone,” says Kellogg. “In politics as in smartphones, these ‘undecideds’ will be the ones device makers will be hoping to win over.”

    Google recently reported that over 150 million Android devices had been activated.

  • Do Your Android Apps Get A Lot of Use?

    Do Your Android Apps Get A Lot of Use?

    It all depends on which Android apps we’re talking about, according to one of Nielsen’s latest studies.

    What they found, while focusing on Android use, that, while most users access mobile web content through applications, as opposed to simply using the mobile web and one of the available browsers. That being said, while app use is greater than mobile web use in the Android environment, quite a few Android apps don’t get used at all.

    The popular ones are used extensively. The others? Not as much:

    Perhaps more surprising, despite the hundreds of thousands of apps available for Android, a very small proportion of apps make up the vast majority of time spent. In fact, the top 10 Android apps account for 43 percent of all the time spent by Android consumers on mobile apps. The top 50 apps account for 61 percent of all time spent.

    Clearly, the idea is to be have an Android app that’s in high demand, otherwise, it will probably sit on the proverbial shelf, collecting dust and not a lot of users. Nielsen even presented a pie chart to visualize the app usage breakdown:

    Android App Use

    As you can see, while there is definite use of Android apps that fall outside of the top 50–39 percent, to be exact–that part of the pie is divided up between almost 250,000 different applications. Meanwhile, the top 50 get to enjoy over 60 percent of the Android crowd using their mobile programs.

    Clearly, the goal is to create an application that already has high demand, or, in the case of something like Twitter, invent something people didn’t even know they wanted and/or needed. The problem with that approach is, the returns may not be immediate.

    Nielsen goes on to discuss just how much time Android owners spend on the mobile web, either via app or mobile browser, of which, Nielsen’s blog post says:

    …the average Android consumer in the U.S. spends 56 minutes per day actively interacting with the web and apps on their phone. Of that time, two-thirds is spent on mobile apps while one-third is spent on the mobile web.

    There is, of course, an additional pie chart to emphasize their findings:

    Android Web Use

    If you’re a mobile app developer focusing on the Android crowd, Nielsen’s findings present something of a dilemma. Clearly, Android users love to use the mobile web, and they prefer to do so with an application. So far, so good. The problem is, if the app being developed isn’t a hit with Android crowd, it may simply go unnoticed and/or unused.

    Obviously, marketing comes into play here, because the idea of making people think they need the item you’re offering is incredibly basic, but also a fundamental approach that should not be overlooked.

    What about you? Do you use Android apps that fall outside of the top 50? If so, are you satisfied? If not, why? Let us know in the comments.

  • Netflix, Hulu Users Streaming Video in Vastly Different Ways

    There is a fundamental distinction between Netflix users and Hulu users, and it goes far beyond who has more allegiance to 30 Rock.

    Netflix and Hulu users differ greatly in both how they stream their content and what content they are streaming.

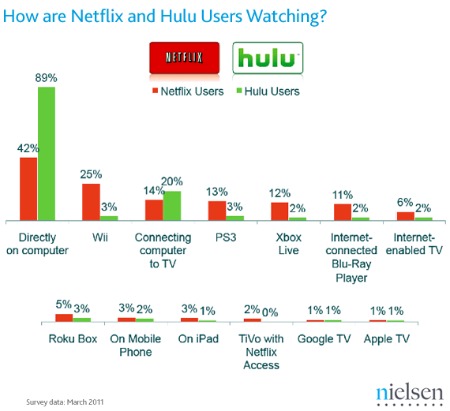
    Nielsen conducted a survey and found that 89% of Hulu users report streaming their video directly to their computers. Only 42% of Netflix users said that this is how they watch stuff. Of that 89% of computer-streaming Hulu users, only 20% said that they connect their computers to their TVs.

    The majority of Netflix videos are being enjoyed on people’s televisions. Whether that be through the Wii, Xbox360 and PS3 consoles or internet-enabled devices like Roku and Blu-Ray players, chances are good that if you’re streaming Netflix, you’re taking it in on a bigger screen.

    One of the most surprising figures to me is the Hulu/Xbox Live stat. Of the 12,000 people that Nielsen asked, only 2% stream Hulu via their Xbox360s? That’s only shocking to me because I remember how excited people were when Hulu announced it was coming to the Microsoft console.

    Nielsen also looked at what users are watching on each service. 53% of Netflix users are watching movies while only 11% say they exclusively watch TV shows. 36% said they watch both equally.

    When it comes to Hulu, a whopping 73% said that they primarily view TV shows on the service and only 9% said that they primarily view movies. 18% said that they watch both equally.

    Does this some something to do with the people? Probably not, as it most likely has more to do with the catalogs. The recent Netflix price hike outrage might cause a significant number of members to say goodbye to their subscriptions, but would they give their money to Hulu Plus instead? It sure seems that at least right now, the two services aren’t competing with each other for the same type of content and user.

  • Android, iPhone Data Use Is Exploding

    Android, iPhone Data Use Is Exploding

    It’s no secret that Americans love their smartphones. In fact, most of them would probably be lost in a sea of boredom and confusion if they were separated from them for a day. One report suggested that 50% of people aged 18-34 own a smartphone, and that number is on the rise. In that same survey, 60% of people would give up TV before giving up their smartphones.

    One in three would even give up chocolate, forever, to keep their smartphones.

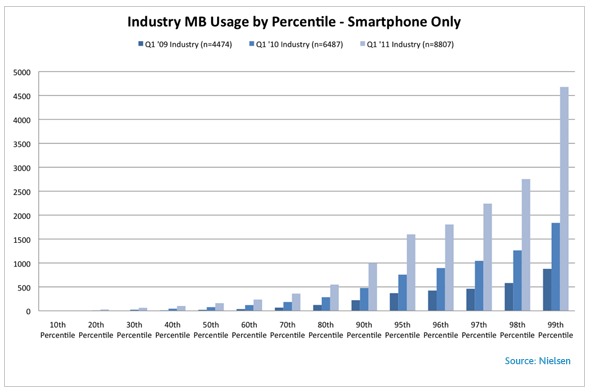
    But not only do people own them, but they use them a whole lot – for high-consumption activities it seems. Nielsen analyzed cell phone bills of over 65,000 smartphone owners and found that data usage has skyrocketed in the last year. In Q1 of 2010, the average smartphone owner used 230 MB a month. In Q1 of 2011, the average smartphone owner uses 435 MB – an 89% increase year-over-year.

    Top consumers continue to grow their consumption at an even faster pace as the top 10% data users grew their consumption 109% and the top 1% of data users grew their consumption a whopping 155%.

    What type of phones are people consuming the most data? Overwhelmingly iPhone and Android powered devices. The average Android owner users 582 MB per month and the average iPhone owner uses 492MB. Both increased year-over-year from around 312 MB. Windows Phone 7 data usage shot up last quarter while Blackberry data usage stayed pretty low in comparison.

    It looks like the giant app stores available to iOS and Android users are to blame.

    The study also reports that cost per MB has shot down to 8 cents this quarter compared to 14 cents back in Q1 of 2010.

  • It’s Official: Streaming Video Consumers Watching Less TV

    Until recently, Nielsen’s data suggested that the heaviest media consumers were the heaviest across every type of media – streaming, mobile, standard TV, etc. Basically, that meant that if you watched a lot of streaming content online, then you also watched a lot of television.

    In their latest Cross Platform Report, they found that simply isn’t the case anymore.

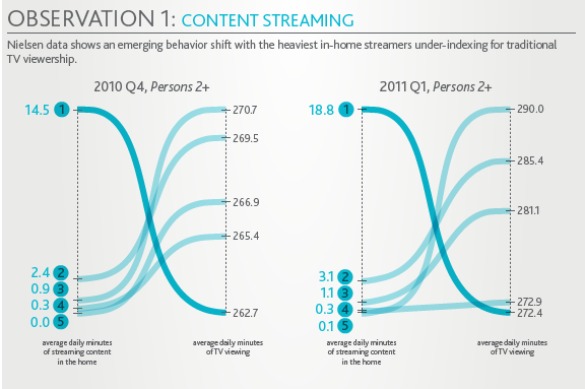
    A subset of consumers from television and Internet homes has now emerged that defies that notion, with the lightest traditional television users streaming significantly more Internet video, and the heaviest streamers under-indexing for traditional TV viewership.

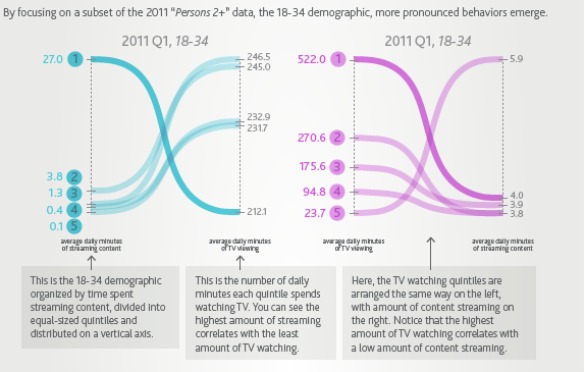
    This behavior is led by those ages 18-34. The group of consumers exhibiting this behavior is significant but small. More than a third of the TV/Internet population is not streaming, whereas less than 1% are not watching TV.

    This means that nowadays, if you are heavy into streaming, you most likely aren’t turning on the cable. Here’s a visual demonstration of this:

    And the next graph shows that the tendency is more pronounced in people aged 18-34. Makes sense, since that is the generation that has grown up on Netflix and YouTube.

    This is interesting news, and unsettling news I’m sure for TV executives and cable providers. Among a set of people (the heavy online video connoisseurs), albeit a small set, they are satisfying themselves almost exclusively with streaming video. Is it only a matter of time until it is not just the heavy internet users who are watching traditional TV less and less?

    As of right now, however, it looks like Americans simply love any type of video you put in their faces. According to Nielsen, overall TV watching increased 22 minutes per person per month year-over-year. Nine out of ten households with TVs have cable service. DVR usage continues to grow and even mobile video has increased 41% year-over-year.

    Will internet video ever completely knock the crown off Television? Let us know what you think.

  • Drudge Report Sends More Traffic Than Facebook or Twitter to Some News Sites

    Clearly, there’s a great deal to be said for news curation. The Pew Research Center’s Project for Excellence in Journalism is sharing some fascinating findings about web news consumption, through a study of audience stats provided by Nielsen.

    The study looked at how audiences get to, how long they stay at (per visit), how deep they go into, and where they go after they leave 25 top news sites in the U.S. Among the key findings is that the Drudge Report is sending more traffic to news sites than even Facebook or Twitter.

    “The Drudge Report ranked as a driver of traffic to all but six of the top sites studied. And, more striking, it ranked second or third in more than half (12), outpacing Facebook,” says Pew Research Center’s Project for Excellence in Journalism. “In some cases, Drudgereport.com is an extremely important traffic driver. While Facebook never drove more than 8% of traffic to any one site, for instance, Drudgereport.com provided more than 30% of traffic to mailonline.co.uk (the British newspaper site the Daily Mail), 19% of the traffic to the NYPost.com, 15% to Washingtonpost.com and 11% to Boston.com and FoxNews.com.”

    “In other words, the Drudge Report’s influence cuts across both traditional organizations such as ABC News to more tabloid style outlets such as the New York Post,” the organization says. “What’s more, Drudge Report drove more links than Facebook or Twitter on all the sites to which it drove traffic.”

    Drudge Report Sends Traffic to news sites

    PBS put together an interesting infographic, further ooking at The Drudge Report vs. Facebook and Twitter:

    PBS - Drudge Report vs. Facebook and Twitter

    Twitter’s lack of influence on traffic to the sites looked at in the study is particularly noteworthy. Researchers Kenny Olmstead, Amy Mitchell, and Tom Rosenstiel say, “Even among the top nationally recognized news site brands, Google remains the primary entry point. The search engine accounts on average for 30% of the traffic to these sites. Social media, however, and Facebook in particular, are emerging as a powerful news referring source. At five of the top sites, Facebook is the second or third most important driver of traffic. Twitter, on the other hand, barely registers as a referring source. In the same vein, when users leave a site, ‘share’ tools that appear alongside most news stories rank among the most clicked-on links.”

    While Facebook and Twitter are essentially both able to be used in similar fashion, Facebook tends to be more personal, while Twitter tends to be more noisy and open. For many users, Facebook is where they are in closer connection with actual friends and family, which can go along way when it comes to clicking on shared links.

    The Drudge Report clearly has a dedicated audience, and has made a name for itself over the years as a brand that audience trusts, which makes it a powerful tool for content curation. Given the very low-key design of the site, these findings speak volumes about influence in news and the significance of content curation in general.

    I do think we will see news consumers start to use Twitter more effectively as a content curation tool (both inbound and outbound) going forward, particularly as Twitter puts more focus on getting users to understand how to use it (which they seem to be doing since Jack Dorsey returned).

  • The Royal Wedding Coverage Volume Highest in U.S.

    “The kind of historic event that only happens once in a generation – the storybook marriage between an anachronistic fascination with the descendants of some very lucky German hemophiliacs and ubiquitous 21st century media hypercoverage.” – Jon Stewart, 4/25/11

    If you are an American and want to hear less about the upcoming Royal Wedding, then it might be better for you to go to the U.K.  Seriously.  Apparently their media coverage of the event is not as aggressive as it is here in the States.

    Say what?

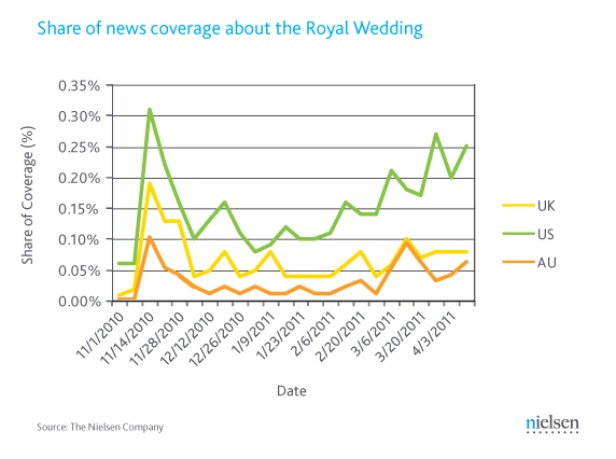
    That’s right, according to a post on the Nielsen blog,  the American news media is covering the Royal Wedding at a higher clip than the Brits.  Since the November 2010 engagement announcement, royal wedding coverage has totaled about .3% of all American news.  This share from traditional media sources is higher than the shares in the U.K. and Australia, combined.

    Now, this statistic isn’t shocking to anyone who frequently watches CNN or other major news outlets here in the States.  Watching many stations, I can’t help but feel like they have decided that the real news is simply too depressing and bleak, so they’re just going to go with fancy British wedding stuff instead.  Sounds like a plan.

    This Nielsen report also includes traditional media online sources from newspapers and magazines.  They studied “buzz factor” from social media outlets as well and found this:

    The study of buzz on social media (blogs, message boards/groups) and traditional media finds that while the United Kingdom creates the greater overall level of consumer buzz about the Royal Wedding, the United States has the highest share of news coverage by traditional news sources, such as the online versions of newspapers and magazines.

    Here is this info in fun convenient graph form:

    The Royal Wedding fever has led to popular websites providing special content and unique pages dedicated entirely to the event.  Earlier this month Yahoo launched a Royal Wedding site with photo galleries, streaming video and a guestbook.  YouTube also announced that they will we streaming the entire event live from their official Royal Wedding channel.  It looks like America has a fever, and the only prescription is more coverage of British socialites.  Or a Kardashian could do something drastic.  That might shift the news cycles.

    Now this isn’t to say that Royal fans in the U.K. aren’t crazy about the wedding.  Remember that thing I said earlier about “Buzz factor?”  Yeah, how’s this for buzz:

    @BritishMonarchy is now officially on Twitter as well, and it is tweeting about the upcoming wedding.  It currently has over 130,000 followers.

    http://www.youtube.com/watch?v=-8msHZ8wI7Y The Archbishop of Canterbury on the Royal Wedding, speaking in a film produced by Lambeth Palace. 1 day ago via Royal Household · powered by @socialditto

    The Royal Wedding is set for this Friday, April 29th.

  • Android Assumes Smartphone OS Lead

    One day after a well-met iPad 2 announcement, it’s a solid bet that the iPhone 5 team at Apple just received orders to work a good deal harder.  New stats from Nielsen indicate that, in terms of U.S. smartphone market share, iOS has fallen behind Android.

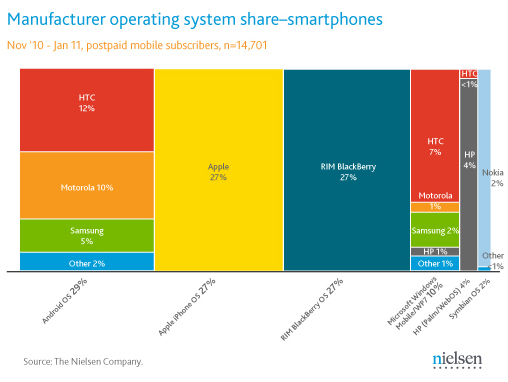
    As the figure below shows, Nielsen believes Android secured a market share of 29 percent during a two-month period ending January 11th.  That puts it just ahead of Apple’s and RIM’s offerings, which are tied at 27 percent, and way in front of the mobile operating systems that Microsoft, HP, and Nokia have created.

    What’s more, another figure indicates Android’s doing quite well in terms of attracting young users.  And that fact’s certain to impress a lot of marketing execs who like to target young people.

    There’s still good news for companies other than Google, however.  Nielsen pointed out in a corporate blog post, "[A]n analysis by manufacturer shows RIM and Apple to be the winners compared to other device makers since they are the only ones creating and selling smartphones with their respective operating systems."

    Plus, even as market shares fluctuate in one direction or another, the overall demand for smartphones continues to grow at a rapid pace, ensuring (or at least making it more likely) that there’s money for everyone.

    We’ll be sure to continue tracking the competition, in any event.

  • YouTube Attracts 8.4 Billion Streams In January

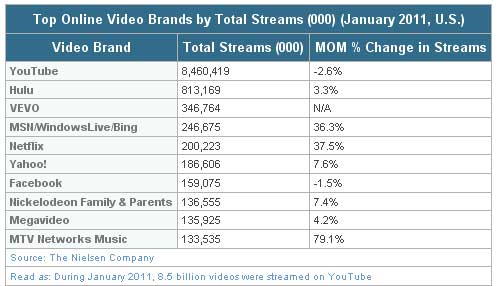
     Online video usage in the U.S. is up significantly from the same time last year as time spent viewing video on a PC/Mac/laptops from home and work locations increased 45 percent, according to a new report from Nielsen.

    The number of unique online video viewers only increased by 3.1% from last January, but the level of activity was up as viewers streamed 28% more video and spent 45% more time watching. Total video streams also saw significant year-over-year growth, up 31.5% to 14.5 billion streams.

    January saw new entries to the top 10 most popular video brands  with music and entertainment site VEVO and video rental site Netflix entering at #3 and #9, respectively. Still a relatively new site, VEVO is showing signs of potential with over 32 million unique video viewers during the month, fewer than 100,000 viewers behind Facebook.

    YouTube continued to be the most visited brand in January with 8.4 billion video streams followed by Hulu with more than 813 million streams and VEVO with more than 346 million streams.


    Top-Video-Brands


    When looking at the most engaging video brands – as measured by time spent – Netflix was the top destination as the average U.S. video viewer spent over 11 hours watching video on the site from home and work locations.

    Nielsen also found 7 of the 10 most engaging video brands also saw double-digit increases in average time per viewer. U.S. video viewers nearly doubled their time spent viewing video on Veoh, spending 2 hours, 16 minutes on average in January. Justin.tv also saw notable growth as U.S. viewers increased their video viewing time on the site by 56% from last month.


  • Android Named Leading OS Among Recent Acquirers

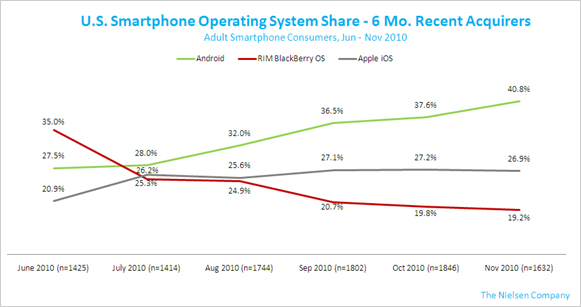
    People who purchased smartphones in the past six months were more likely to buy an Android device than an Apple product by a ratio of about 1.5 to 1, according to a new report from Nielsen.  This led the data research firm to give Android the enviable title "leading OS among recent acquirers" this morning.

    The graph below should make the basis for the title clear.  More and more consumers decided to give Android a try during the second half of 2010, while in terms of percentages, Apple’s iOS hasn’t made much progress in recent months and the BlackBerry OS is losing ground.

    Of course, those trends don’t exist in a bubble, and so Android’s also doing well in terms of overall market share.  Nielsen put Android’s share at 25.8 percent, not too far behind iOS’s 28.6 percent.

    Meanwhile, the BlackBerry OS might soon fall out of the race, as its share has slid to 26.1 percent.

    Nielsen reported, however, "This much is clear . . . All three smartphone OS leaders – Apple iOS, RIM Blackberry and Android – are benefitting from strong demand for smartphones.  In November, 45 percent of recent acquirers chose a smartphone over a feature phone."

    That figure’s sure to increase over time, too.

  • Nielsen Names YouTube Top Mobile Internet Video Channel

    To mark the end of 2010, Nielsen published a document called "The Top Trends for 2010" this morning, and it’s an interesting read, even if most of the lists don’t fall within the scope of this site’s coverage (FYI: "frozen novelties" were the top consumer packaged good on the basis of unit volume growth).  But one thing that is relevant is the fact YouTube was crowned "Top Mobile Internet Video Channel."

    This counts as an important victory for Google.  The search giant of course wants as many people to visit its sites as possible, and that may go double for YouTube, considering the $1.65 billion Google paid for the site.

    Then there’s the advertising angle to consider.  Google’s been making a real effort to present YouTube as a place where everything from small businesses to mainstream brands can get their message across, and this win could reinforce that idea and help bring in revenue.

    Anyway, second place went to Fox, according to Nielsen.  Then Comedy Central, ESPN, and MTV followed in third, fourth, and fifth places.

    Next, ABC, CBS, AdultSwim, NBC, and the Discovery Channel occupied the rest of the spots on the "Top 10 Mobile Internet Video Channels" list.  (If you noticed a big name missing, licensing issues hurt Hulu’s ability to compete.)

    Congrats to Google and at least the leading handful of YouTube’s competitors.

  • Nielsen Finds iOS, Android Tied In Terms Of Desirability

    Roughly three years after its official debut, the Android operating system has more or less caught up to Apple’s offering in terms of desirability, according to Nielsen.  The research company declared Apple’s iOS and Android tied today after surveying potential smartphone upgraders in the U.S.

    So we’re not accused of a pro-Google bias: yes, the graphic below shows that iOS has a slight edge.  But stats master Nielsen apparently decided the difference is small enough that the term "tied" still applies.

    That assertion’s very important for Google.  First, it confirms Android’s success to date in becoming desirable, which is no small feat given the mind share and market share other mobile operating systems used to enjoy.

    Second, it points to increased Android dominance in the future, since smartphone upgraders should be buying Android phones left and right.

    Anyway, if you’re curious about how the data broke down, Nielsen reported in a blog post, "Among users planning to get a new smartphone, current smartphone owners showed a preference for the Apple iPhone (35 percent), while 28 percent of both smartphone and featurephone planned smartphone upgraders indicated they wanted a device with an Android operating system as their next mobile phone."

    Also, "Women planning to get a smartphone are more likely to want an iPhone as their next device, with slightly more males preferring Android."

  • Mobile Users Are Using Their Devices in Your Store. Are You Taking Advantage?

    Mobile Users Are Using Their Devices in Your Store. Are You Taking Advantage?

    9 out of 10 mobile Internet users have accessed the mobile web while at a store, according to a new study from Yahoo and Nielsen. Furthermore, 51% of those users indicate that they make a purchase after doing research on their mobile device. 

    "As consumers increasingly turn to their mobile device throughout the day, particularly when making purchasing decisions or even while watching television, marketers have a tremendous opportunity to reach a captive, commerce-oriented audience," a representative for Yahoo tells WebProNews. 

    The study found that 50% of in-store mobile web activity is related to shopping. Frankly, I’m a little surprised this number isn’t higher, but the fact remains, people are researching products on their phones even while in-store. This represents a need to research your own competition online and look for ways to make sure customers make the purchase while they’re in your store. They’re already there, so you already have a tremendous advantage. 

    On average, 16% of consumers use their mobile phones for shopping research, while 57% among mobile internet users and 41% among non-mobile Internet users expressed interest in using mobile phones for shopping research in the next 12 months, the study found.

    One significant finding is that 1 in 5 mobile shoppers who have seen advertising during the shopping process say they always look at it. With that in mind, consider that the things consumers want mobile ads to include are price, product features, and benefits. 

    One other random, but interesting finding related to in-store mobile use is that 48% of in-store mobile users take and/or send a picture of a product to a friend or family member. This represents opportunities for customers to attract new customers to your store, particularly if you’re selling unique products. 

    Similarly, with so many people using their mobile devices in-store, check-in apps should command at least some of your attention. While usage of these apps is relatively small so far, you can expect them to grow, and they present tremendous opportunities for businesses to not only attract the attention of users of these apps (with special offers), but for friends of those users. See Yelp’s new check-in offers feature. Users can sync their check-ins to their Facebook and Twitter accounts. 

    If you do any television advertising, you may want to look at integrating your campaign with some mobile elements as well. The study also found that 86% of mobile Internet users (and 92% of 13-24 year olds) are using their mobile devices simultaneously with TV.


  • Yahoo and Nielsen Research the “Smarter Marketing Mix”

    Nielsen and Yahoo introduced some new research on cross-platform optimization today at Ad:Tech NY. The results are interesting, but Nielsen SVP, Media Product Leadership Howard Shimmel warned not to generalize the findings. It’s more about how they got to the results. The goal is to help the decision process. 

    "What we want you to take away is a new approach," he said, which requires a lot more detail and attention – "microscopically analyzing" each individual medium and the ways in which these media work together, to optimize for an overall plan. 

    Howard Shimmel of Nielsen

    "How do media work together?" Yahoo VP, Global Head of Corporate and Media Research Radha Subramanyam asked. "This is not an isolated world we live in…What does an optimal media mix look like?…There is no one size fits all."

    Radha talks Marketing Mix

    The companies claim the study is the first of its kind to include TV, online, and print. It’s designed to help marketers develop an approach to measure and optimize the effectiveness of cross-platform campaigns, improve reach, frequency and GRPs by changing media allocation between  online, TV and print, while keeping the total cost the same, and understand whether it’s better to re-allocate money across one platform or multiple platforms. 

    The study looked at campaigns in four categories: auto, credit cards, CPG, and retail:

    Key findings were significant under-investment in online, diminishing returns in traditional media, and the need to distribute media across more than one platform. 

    You can find the report available for download here.