WebProNews

Tag: Google Maps API

  • Google Maps API Luminaries Serve Some Golden Eggs of Developer Help

    Since the Google Maps API became available for developers with a cartographical itch, digital cartographers have been putting their imaginations to impressive use with the designs they’ve come up with. One of the most prominent themes during the Google I/O conference last week was the sheer girth of new tools and features that were announced across the many, many Google products. Several of those features pertained to Google Maps and Google Earth, mostly on the design front.

    The Who’s Who of Google Maps API got together during Google I/O for a fireside with some of the digital map developers that attended the conference to answer some questions about Google Maps API, Google Earth, and KML. On hand to take questions from attendees were Thor Mitchell, Susannah Raub, James McGill, Sean Askay, Andrew Foster, David Wang, and Peter Birch.

    Topics discussed ranged from how to use Google Earth’s 3D images when developing mobile apps, how V2 ads perform against V3 ads when using Google Ads Manager, and how businesses can get photos of their interiors included in Google Business Photos (although this question seemed to befuddle some of the Googlers on stage). It’s kind of fun to watch how quickly the Googlers will pass off the microphone as quickly as possible as soon as it becomes apparent who should be answering the question. At the end of the talk, the gang then plays an impromptu version of Nickelodeon’s 1980’s classic You Can’t Do That on Television that resulted in Peter Birch receiving a torrent of green slime for being the first person to say “I don’t know.” Incidentally, he wasn’t even saying it as an answer but, hey, dems the breaks, Google Mappers.*

    *They didn’t actually do the You Can’t Do That on Television thing. Sorry.

  • Google Maps API Gets More Features for Styled Maps

    In the two years that it’s existed, designers and developers have created some pretty awesome stuff with the Styled Maps in the Google Maps API. There was that zombie apocalypse survival map along with several arty and crafty maps, like the Maps Without Maps and Time Shutter. There’s also the now-abandoned Mood of Our Cities Now map, which NBC created to display how America is feeling about regional news. Another cool example of a developer creating some stunning designs is the Stories Unbound map.

    As if those maps weren’t impressive enough, Google Maps announced today that it’s rolling out a few additional features with which developers will no doubt utilize and dazzle our eyes and minds. Google Maps API PM Thor Mitchell shared the three new tools on the Google Geo Developers blog earlier today:

  • You can now specify a precise color for features as an RGB value in addition to the existing adjustment filters for hue, saturation, lightness, and gamma.
  • You can now style the outline stroke of features separately from the interior fill, and the label text separately from any icon.
  • You can now adjust the width of line features such as roads and rivers, and also the width of feature outlines.
  • Seriously, if you think the collection of maps currently on display over at the Google Developers Showcase is something, the new levels of detail might be about to get a little scary. Check out the interactive map below that uses all three new options.

  • Google Challenges You To Think Outside The Map

    Despite losing some key partners and a price reduction, the Google Maps API is still pretty popular around the world. Google Maps is one of those brands you can trust and people have built some terrific things with the API. What’s that? You want to build even more insane things with maps? Well, Google has the perfect session for you.

    The Google Maps API team presented at Google I/O this week and the talk challenged developers to think about Google Maps as more than just that – a map. The technology can be leveraged in numerous ways to provide all kinds of handy information to users. It can be combined with other APIs to bring powerful new location-based tools to the market.

    People may see Google I/O as a place for computer engineers and computer scientists to gather and talk about the latest breakthroughs in JavaScript or C++. While that may be true for a talk on say Apps Script, it couldn’t be further from the truth when it comes to Maps. The session above covers the numerous ways Google Maps is being leveraged to provide services to varied industries from real estate to retail.

    If you’re a hardcore Google Maps developer or just curious, the above presentation is for you. Google Maps is definitely one of the more exciting products from Google, at least from a consumer point of view. Developers getting the most out of the API yields some fantastic results that helps people in all walks of life. Check out the video to learn more.

  • Google Maps API Gets Transit, Symbols, Heatmap Layers; Now Locates Pot Farms

    The buzz of all things Google continues at the Google I/O conference, meaning there are some announcements that may trigger the interest of Google Maps API users.

    Perhaps the most notable addition to the inventory of Google Maps API is the inclusion of public transit directions that can be used in Google Maps Javascript v3 and the Directions Web Service. According to an accompanying post on the Geo Developers Blog, “the transit route responses include the number of stops, direction of travel, and more.” The blog post includes an interactive demo of the transit layer, of which you can see an image of below:

    Google Maps API Transit Layer

    Google Maps API Product Manager Thor Mitchell announced two additional features arriving for the Javascript Maps API: Symbols and Heatmaps. Elaborating on the Symbols tool in a blog post, Mitchell described the new feature:

    Unlike the image icons currently used for marking locations on a map, a Symbol is defined as a vector shape. The size, stroke width, color, and opacity of the shape, are all set by the Maps API application and can be dynamically modified. A small number of shapes, such as a circle, are provided by the Maps API, and custom shapes can be expressed as an SVG path.

    Below’s an example of Symbols at work, this one illustrating how Walmart slowly colonized the southern United States in its early stages of retail domination.

    Google Maps API Symbols

    If you want to indicate any kind of directional flow on a map, Symbols can also be used to spruce up polylines on a map:

    Google Maps API Symbols

    Finally, if the symbol method isn’t how you’d like to represent your data on a Google Map, developers now have the option of representing data as a heatmap. Using the same data about Walmart’s conquest of the United States retail landscape, below you can see the information represented differently with the heatmap:

    Google Maps API Heatmap

    The full Google Maps presentation at Google I/O can be watched below:

    Concerning the lead image of the article, that was an example that Google Maps VP Brian McClendon used to explain how Google confirms users’ additions from Google Mapmaker and how, sometimes, the Google Powers That Be can’t really fix everything that people submit.

    Perhaps, in other words, some things are better left “unfixed.” But any rate, just for the sake of being clear, there is not a Google Maps layer to show you where to find the nearest marijuana farms.

  • After a Flood of Lost Customers, Google Maps Sticks a Finger in Dike

    Here’s a question everybody knows the answer to: when you start losing customers because they’re opting for cheaper or even free alternatives, what do you do?

    Answer: You lower your prices.

    That answer appears to be what Google Maps has chosen to do in light of the continued attrition of developers and businesses that have been defecting from using Google Maps API since the company announced last October that it would be charging fees to smaller businesses that have 25,000 page views a day in a 3-month period. Expectantly, this did not sit well with Google Maps’ customers and soon a parting of the ways was underway for many who did not wish to pay the fees. While companies like Apple and Wikipedia wouldn’t have been affected by the pricing change, the two companies’ departure came at a time when the mapping service was already losing developer interest for other firms like OpenStreetMap and deCarta, amounting to a pretty bad reflection on Google Maps.

    Responding to the bad publicity and disgruntled developers, Google Maps announced today that while it wouldn’t be rolling back the new usage limits it implemented last year, it is dramatically reducing the prices for businesses to use Google Maps API. In a post on the Google Geo Developers Blog, Google Maps API Product Manager Thor Mitchell detailed that the company will be reducing the cost from $4 per 1,000 page views to $0.50. Additionally, Mitchell said there will no longer be a price difference between using the Styled Maps and using the default Google Maps style.

    Google Maps also appears to be trying a new approach with businesses using Google Maps API with a more less rigid policy regarding page views.

    We’re beginning to monitor Maps API usage starting today, and, based on current usage, fees will only apply to the top 0.35% of sites regularly exceeding the published limits of 25,000 map loads every day for 90 consecutive days. We aren’t automating the application of these limits, so if your site consistently uses more than the free maps allowance we’ll contact you to discuss your options. Please rest assured that your map will not stop working due to a sudden surge in popularity.

    While Google Maps is likely not suffering a loss in search traffic just yet due to the loss of its API users, the company will certainly be seeing some new challenges in the following months what with Apple launching its own Maps app for iOS 6. Before Google Maps finds out just how much Apple’s Maps will bite into its market share of search, it’s probably a good move for Google to attempt a reconciliation with the businesses and developers that are feeling a little scorned about the usage limitations.

  • Google Maps API History Revealed In Office Hours

    The Google Maps team does some of the more interesting things on the Web. It’s always a pleasure to hear what they have to say so this week’s Office Hours hangout is a treat.

    This week has Josh Livni and Peter Birch of the Google Maps and Earth team talking about the Google Maps API. They start the hangout with a look back on the history and evolution of Google Maps and Google Earth. It’s revealed that Google is heavily investing in Google Maps and Earth for mobile devices. It’s by far the most popular form of the application for people and they are constantly updating it for the needs of those who want to use it.

    Livni and Birch also reveal that mobile is now the platform where they do most of the experimentation for Maps and Earth. Since it’s still a relatively new platform, they can do these kind of things without the ramifications of mucking with desktop applications. These experiments are then brought to the desktop platform once proven successful.

    Mobile is a key topic in this hangout as the team also talks up the changes coming to Google Earth mobile. One of these changes is that users can implement their own data into Google Earth to set up tours. Users should also be able to download tours for the area that they’re in via mobile.

    All this and more is discussed in this week’s Maps API hangout. It has a lot of really interesting insights into Google Maps and Earth. Check it out:

  • Paul Rademacher Talks Google Maps API During Hangout

    I’m really starting to like this casual conversation thing Google has going on with its Hangouts. It’s nice to see developers just discuss the stuff they’re working on without any PR or companies getting in the way of what they can say.

    This week’s conversation is between Paul Rademacher and Mano Marks during the Google Maps API Office Hours. You may know Paul Rademacher as the creator of Housing Maps, the first Google Maps Mashup.

    Rademacher was also a Googler from 2005 to 2010 where he created the Google Earth Broswer Plugin. It allowed users to “embed the full power of Google Earth into any Web page.” He is also credited by Mano Marks as being the creator of the Google Maps API.

    All of this is to say that Rademacher knows what he’s talking about when it comes to Google Maps. In this 40 minute long hangout, he discusses his newest project – Stratocom – with Mano Marks. Stratocom is a new application built using the Google Maps API that displays “beautiful satellite and aerial imagery.”

    Don’t be misled though, this is all about the coding experience in Google Maps. The two men will talk about developing for the Google Maps API. Check out the video below for all the details:

  • Google Updates Its Deprecation Policy

    Google Updates Its Deprecation Policy

    Software gets old. It’s an unfortunate truth that many developers have to live with. It’s even harder when you have to deal with software that may be deprecating and it’s hard to know when official support is going to dry up.

    Google is hoping to make all of this easier by changing up their software deprecation policies. These include the changing some APIs to a one-year deprecation policy while just retiring some APIs outright. So let’s get into the nitty gritty of it to see which APIs are being affected.

    First up is the change to a one-year deprecation policy. They are not deprecation the APIs themselves, just the policy. The four APIs that are affected by this new policy are the Google App Engine, Cloud Storage, Maps/Earth API and the YouTube API. The App Engine, Maps and YouTube API will wind down from their three-year API deprecation period in April 2014 and transition to the new policy. Cloud Storage is keeping its current one-year policy.

    For the above mentioned APIs, Google is writing a new policy that is clearer and more concise. Google says that the new policy “simply states that we will strive to provide one year notice before making breaking changes.”

    A metric ton of other APIs will be losing their deprecation policies. To be clear again, Google is not removing these APIs. To give developers time to get things up to snuff, the current deprecation policies for these APIs will not be removed until April 2015. The current list of APIs to lose their policies are as follows: Accounts API, AdSense Host API, Chart Tools API, Checkout API, Contacts API, Custom Search API, Documents API, Doubleclick for Publishers API, Feed API, Google Apps Admin APIs, Libraries API, Orkut API, Picasa Web Albums API, and Prediction API.

    In sadder news, Google will be retiring some of their older APIs. These include the Moderator API, Legacy Portable Contacts API, ClientLogin, AuthSub, OAuth 1.0, and Google Chart Tools. They are also retiring the non-current versions of Spreadsheets, Contacts, Documents List and Freebase APIs. Last but not least, the Finance and Feedburner Administrative APIs will finally be retired after being depreciated last year.

    While some developers may cry fowl at these changes, Google assures you that they’re only doing this to make it easier for people to stay on top of the current tools available to them. This should allow everybody to be a level playing field in terms of the newest technology.

    What do you think of Google’s new deprecation policies? What about their massive removal of several API policies? Let us know in the comments.

  • Google Maps API For Business Gets Demographic Layer

    There’s a lot of information a map can provide. Just taking a look at what Google Maps already provides is testament to that. There is one area, however, that most maps don’t make use of – demographics.

    That’s to be a thing of the past since Google has announced that their Maps API for Business is now getting a U.S. Demographic Layer. This will allow developers to launch new map applications that feature demographics information.

    All the demographic data used in the new feature comes from Nielsen. The information you can expect to have access to includes population, age, race, marital status and housing status. The data available is from 2010 and 2011 alongside projected data for 2015 and 2016.

    As for actual use of the Demographic Layer, developers can “control how the data is styled, such as defining color thresholds or gradients, and also define style rules based on expressions across statistics that are evaluated in real time.” Google uses the example of using color to visualize population density on the map.

    You can start using the Demographics Layer now if you’re inclined to. Just be aware that you can only use it for internal applications. For an idea of how to use the new layer, check out the documentation here. It should give you all the information you need to get started on making new applications powered by demographics data.

    Here’s a video that explains all the features of the Demographics Layer. It also gives you an idea of how you will be using the layer. Check it out and tell us what you think:

  • Mapping Wikipedia Visually Ignites The World’s Interest In Knowledge

    That’s not a Lite-Brite representation of North America above this article. It’s not a photo of some dorm room blacklight poster, either. What you see above is actually much more meaningful: a visual representation of the continent according to how different regions access Wikipedia in different languages. Mapping Wikipedia, as the project is called, came about as a collaboration between the Oxford Internet Institute and TraceMedia. The glowing, ISS-view night-vision of earth you see in the map represents the density of all the geo-located articles from a variety of languages.

    Users can select one or more language from English, French, Arabic, Egyptian Arabic, Farsi, Hebrew, and Swahili. If you’re curious as to why all the selection of languages seem Middle East-centric, that’s because the project is a part of a larger effort to understand how Wikipedia is accessed in the Middle East and North Africa. The map itself, as you see, was developed using Google Maps API.

    In addition to looking at different languages and locations, you can change your search to reflect different components of Wikipedia, such as the density of authors in a region, anonymous edits, section depth, and word count. Depending on what you search for, you’ll see a legend in the bottom-left corner that tells you which colors indicate which density.

    The Oxford Internet Institute had a very academic reason for collecting the data that helped create the map, but for the mere aesthete, the map is a beautiful work of art.

    [Via Visual.ly.]

  • Mercedes-Benz Hits The Road With Google Maps API

    Mercedes-Benz is steadily becoming what some might consider the iCar. First, the car company debuted its first smart car at CES 2012. Then, Mercedes-Benz announced that Apple’s Siri would be included in its A-Class line of vehicles, plus it has some kind of Facebook and Twitter access built into the dashboard. Now, the manufacturer of Mercedes-Benz, Daimler, have used Google Maps API to create a series of interactive maps accessible from the car’s dashboard.

    Mercedes-Benz Google Maps

    Mercedes-Benz Google Maps

    From the Lat Long Blog:

    The vehicle’s integrated navigation system will be enhanced in certain regions by a fully functional JavaScript Maps API v3 implementation using Styled Maps, Google Places API, Places Autocomplete API, traffic layer, and the Panoramio layer as an Android App for the AMG Performance Media option. This provides the user with a familiar Google Maps interface in addition to the onboard maps from the navigation system.

    In addition to being able to perform Google Maps searches from the convenience of your car console, you’ll have access to several overlays developed with Google Maps API. One of the more useful maps you’ll find is a low light map that’ll make it easier for the eyes to read without making your pupils dilate too much as you switch from the road to the map.

    Mercedes-Benz Google Maps

    If you’re driving into parts unknown, drivers will also be able to view the destination with its environs via Google Street View.

    Then again, with all of these features, if you’re driving maybe you should, y’know, drive and let your passenger navigate through the Google Maps menu.

  • This Zombie Survival Map Could Very Well Save Your Bacon

    This Zombie Survival Map Could Very Well Save Your Bacon

    You don’t want to be the aperitif at a zombie feast. Nobody does. But when the undead arrive, if the film genre is any indication, assume that there will be lots of them and they have appetites incapable of being spoiled. Worse, we remaining humans will find ourselves bereft of all reliable resources for our survival. You’ll need all the help you can get. Luckily, a forward-thinking fellow named Jeff at doejo.com has got you covered and put together a zombie survival map with locations of all the necessities you need to survive on a zombified planet.

    Using Google Maps API, Map of the Dead (not to be confused with this other Map of the Dead) displays a color-coded key of all of the necessary locations you need to know about in order to survive in a world of zombies. Everything from military resources and cemeteries to pharmacies and liquor stores are included in the map so you’ll be able to find the closest supplier for your needs whenever you run out of something.

    Map of the Dead

    Map of the Dead

    The map identifies danger zones, which are described as areas having a high risk of zombie infestation due to the presence of man-made structures. If you’re to go by what the map tells you, zombies are a cosmopolitan class of monsters who only want to hang out in well-developed cities. As you can see below, if you cross the river over into that charcoal-colored area of wilderness on the map you’ll be safely beyond the reach of the zombies’ clutches. However, all of the resources you need are still on the zombie side of the river, so… pack up before you go, I guess?

    Map of the Dead

    Cleverly, you can also download a copy to print off and store away in a safe place because, really, if the zombie uprising jumps off, do you think they’re going to provide very reliable IT support? No, but at least you’ll have your trusty map.

    As things go, it appears that Central and South America as well as most of Asia and Africa will be largely unaffected by the zombie populations, so in lieu of risking your life and fighting off the legions of undead, you could always just put some money aside and jet down there at the first sign of trouble. Canada, oddly enough, seems to be of no regard to zombies as the country appears to be zombie-free. Cuba, however, seems to have a zombie problem, which figures – will there ever be a time when it’s okay for Americans to safely travel to Cuba again?

    [Via Neatorama.]

  • Google Maps API Layer For U.S. 2010 Census Now Available

    Remember a couple of years ago when the Census Bureau people came canvasing through your neighborhood, knocking on your doors to collect your demographic information? I do, because they kept coming back to my apartment even after they initially visited me and I had to keep telling them that, despite my shocking magnitude, I can only accurately represent one single person in one single household.

    Aside from merely representing the general population characteristics of the United States, the demographic information can be a immensely useful for anyone doing research or possibly even as a marketing strategy. To make it easier for others to utilize this mountain of information, the Google Maps API team have developed a Demographics layer that visualizes the data gathered during the 2010 census onto the regular map. As you would expect, the layer presents population information regarding age, race, marital status, income, and all of the other relevant data from the census. Via its Enterprise Blog, Google put together a demonstration of the Demographics Layer in the video below.

    In addition to census data relevant to 2010 and 2011, the API also features the projected data for 2015 and 2016. The visualizations can be manipulated on a scale ranging from state-by-state analysis to as micro-focused as a selection of city blocks and developers will be able to toggle how the different demographics are color-coded.

    A similar demographics layer has been available in Google Earth Pro but this is the first release of the API for Maps. The Demographics layer comes as part of the general Google Maps API for Business package so developers won’t have to purchases a separate license to get their hands on this new tool.

  • Google Maps API Gets Fun New Weather Layer

    Google Maps has had the real-time weather layer available since this past August, which gives Maps users a new way to check the current weather as well as see the forecast for the next few days. The layer also has a feature that toggles current cloud formations above earth, too, so you’ll know if you can leave the shades at home.

    Starting today, the weather layer will now be available to the Google Maps API so developers can play with the weather (too bad “play with the weather” there isn’t in any kind of X-Men sense) when they’re building up their own maps. Developers can find the Maps API in the “weather” library as two different classes: “WeatherLayer” and “CloudLayer.” I’m sure you can imagine the function of each.

    The weather layer has different functions to accomodate for what part of the world you reside in, so you can see the temperature in fahrenheit or celsius, see the wind speeds in miles or kilometers, and so on. Fortunately, we all measure cloudiness in the same way so at least that feature is standard.

    Google’s being greedy about being able to embed the map with the weather layer so you can navigate around and see how it works, so below is just a screenshot. If you want to see the weather layer in action, you’ll have to go to Google Maps or go tinker with the example that was provided on the Geo Developers Blog.

    Google Maps API weather layer

  • Google Maps Analytics For Business Opens Up Troves Of New Site Data

    Google Analytics is an invaluable tool for any business working on developing their brand in how it allows businesses to study many different variables such as where the web traffic is coming from, how much time was spent on their site, and so on. Google Maps announced today that, similar to how Google Analytics allows webmasters to evaluate what works and doesn’t work on their website, businesses will now be able to use Analytics with their Google Maps in order to evaluate the interactions of customers as they toggle the Google Map embedded in the business’ homepage.

    For example, if your business is in one of the many locations where Google Maps has made available the 45 degree view, you can change the map on your business page to display this vantage. With Analytics for Google Maps API for Business, you’ll be able to see whether or not this change increased the interaction visitors have with your map. You’ll be able to assess other interactions visitors have with your map, which Google explains in the provided demonstration video below.

    Other interactions you’ll be able to see include whether or not a visitor uses Street View and if they bookmark your business to their Places.

    The Analytics for Google Maps API comes with the Google Maps API for Business package.

  • Google Maps API Introduces Store Locator Utility Library

    Google Maps is one of the cooler services the search giant has to offer. While I usually use the service to get a street view of the Amazon, some people actually use it for business. Some business Web sites implement Google Maps on their site as a store locator so customers can easily find their location. Google thinks they can provide something better than just a store locator though.

    Today Google Google+Geo+Developers+Blog%29″>introduced the Store Locator Utility Library, an open-source library that “makes it simple for developers to create interactive, useful store locators.” You see, the fine folks at Google found that store locators before were just that, store locators. This new tool allows developers to get creative and create custom store locators that really pop out.

    With the Store Locator Utility Library, developers can now create custom store locators with these functions: list of stores, InfoWindow with detail, HTML5 geolocation, street view, autocomplete search and directions. While these were all features in Google Maps proper, this makes it easier for developers to implement all these into a single store locator application.

    One of the more unique features of the new store locator is that it can draw from a database to fill in the store locator with all the locations. The video below uses the example of pulling data from data.gov.au to find all the medicare offices in Australia. A user can then search from within this store locator with autocomplete to find the medicare offices closest to the Google Sydney office.

    While the new utility is doing all the hard work for you, developers can now focus on making things creative. Using the medicare example again, the video shows the usual Google Maps pins being replaced by the Medicare logo. This is just one example of customization. Imagine if you will the Best Buy store locator using their logo as pins. It would make a store locator far more attractive and custom branded to the business’ interest.

    Check out the full video below for all of the details. If you want to get started right away on making changes to your store locator, you can grab the open source utility library at the project homepage.

  • Google Maps API Gets Some New Digs To Show Off The Wares

    Since 2005, Google Maps API has resided within the general developers corner of Google at code.google.com. Today, via the Lat Long Blog, Google Maps announced that they’ve created a new home for Google Maps API creations that will better showcase the innovative uses that developers have made. From the blog:

    In addition to having all the same developer content that was previously available on code.google.com, the site is designed to highlight and illustrate new features of the Google Maps API through fun and interactive demos. Our goal with developers.google.com/maps is to inspire the next wave of innovation on the Google Maps API, and to connect developers and decision makers with the tools and services that can make their products better.

    The new developer site will be curated by the Google Maps API team and comes equipped with a tagging feature to filter searches by theme (like Art or Crime) and/or the Google Maps API used. Although there are only 139 maps currently available in the showcase, many are related to campus maps and vacation-planner maps. To highlight some of the more eccentric maps you’ll find at the new Google Maps API, here are some of the more captivating offerings from developers.

    Maps Without Maps, which as you can see, depicts a world without borders. Aside from it’s intensely minimalist design, the map was built to as a challenge to ourselves to “rethink how we interact with maps” by turning the task “finding a location into a foreign task.”

    The Guardian’s Mapping the Riots With Poverty shows the outbreak of riots last year in the UK. The map creates a comparison between location of the riots and areas stricken with low income.

    A fascinating map sure to resonate with history buffs is Time Shutter. This map depicts how cities have changed over time by overlaying historical maps over modern Google Maps. Additionally, users can submit historic photographs to help reconstruct the cities as they once were.

    And while this map isn’t currently included in the developers showcase of Google Maps people have built, it’s still one of my favorites: NUKEMAP. Drop a nuclear bomb on any place in the world to see the yield and destruction on what such an event would have on an area.

  • foursquare Upgrades Maps With MapBox, Dumps Google Maps API

    Since everybody’s getting prettier maps these days, foursquare didn’t want to be left out of the fun so they announced today that they’re upgrading the quality of their maps with the help of a new mapping startup, MapBox. All of the same foursquare functions will work as they ever did – it’s just going to look a lot sharper the next time you check in to your favorite watering hole.

    A post to foursquare’s official blog explains why they dumped Google Maps API (which they’d been using prior to the update), passed on using MapQuest, and instead hitched up with the nascent MapBox:

    We’ve been using the Google Maps API since the early days of foursquare. In the last six months, though, we’ve seen an increasing number of companies migrating to other options. So, during our January hackathon, one of our intrepid engineers wondered what the world would look like if we made our own maps. To do that, he used data from OpenStreetMap. (It’s a crowd-sourced global atlas, and it’s kind of amazing! It’s like Wikipedia for geography.) We love the idea of open data, and were happy to try it out.

    Around this time, we reached out to the wonderful team at MapBox (hot new startup alert!) to see if they had any ideas. They were making gorgeous maps with the OpenStreetMap data. And, like all great love stories, the timing here was perfect. Earlier this week, they launched MapBox Streets, which now powers all of foursquare.com’s maps.

    For those new to OpenStreetMap, it’s a wiki-style open-source mapping service, which was one of the major selling points that drove foursquare’s decision. Additionally, foursquare cites the higher cost of using Google Maps API. Additionally, any open source platform always has the potential to lure in more developers, which can then boost the performance and quality of the service.

    The maps created by MapBox are nothing short of aesthetically pleasing:

    And when compared to the Google Maps design, MapBox appears to be a lot more info-rich, spatially speaking. For one, MapBox actually provides you with an outline of what the buildings within the city blocks which provide great reference points for navigators. Plus, Mapbox is simply sleeker.


    View Larger Map

    Maybe it’s apropos of nothing, but the timing of foursquare’s announcement that they’re no longer going to be using Google as a partner with their platform coming on the eve of Google’s new privacy policy going into effect is… well, it’s just peculiar. That’s all.

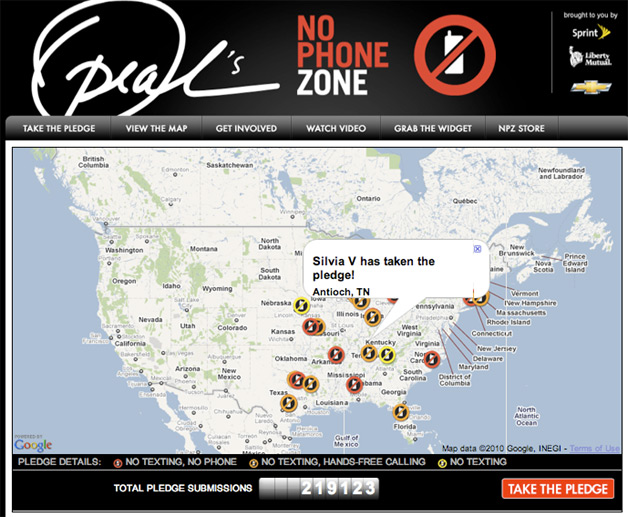
  • Google Maps No Phone Zones for Oprah

    Google Maps No Phone Zones for Oprah

    Google announced today that has provided mapping (via the Google Maps API) for a couple of highway safety initiatives around the use of cell phones in vehicles.

    The first such initiative is Oprah’s "No Phone Zone", which lets users make a pledge under three different options: no texting, no texting plus handsfree calling only, and no phone use at all while driving. These pledges are then mapped in near real-time using the API, so others can see where and when these pledges were made.

    Google Maps No Phone Zones

    The second initiative is about educating people about state policies related to phone use on the road. There is another map in which users can click on a state to see restrictions on texting, handsfree, and handheld phone use. Users can then click through for more details from the Governors Highway Safety Association, or even contact a state Governor’s office directly.

    view policies on phone use

    "Mobile communication has revolutionized the way we live, but unfortunately, irresponsible use has also made the roads more dangerous," says . "In 2008, nearly 6000 people lost their lives in the US and more than half a million people were injured in police-reported crashes during which some form of driver distraction was reported — and according to the National Highway Traffic Safety Administration, cell phone use was a major contributor to that."

    I’ll go out on a limb and say Google does not want you to view these maps on your phone while you’re driving. Oprah’s site has more info about the No Phone Zone initiative.