WebProNews

Tag: analytics

  • TrenDemon CEO: We Connect Content Marketing to Sales

    TrenDemon CEO: We Connect Content Marketing to Sales

    The CEO of TrenDemon, Avishai Sharon, says that they created their cloud-based software solution in order to help companies prove that the marketing content they produced also achieved business goals and sales. In order to show this correlation, the TrenDemon software analyzes all of the different touchpoints the customer has had over his lifecycle and then reverse engineers those successful journeys in order to find out what content is working.

    Avishai Sharon, Co-founder & CEO of TrenDemon, discussed their software on ILTV:

    How Do You Connect Content Marketing to Sales?

    My personal background was heading a marketing agency for many years and one of my biggest struggles was how do I prove our value and our effort to our customers and how do you connect the impact of what we call content marketing to business goals and to sales? When we couldn’t find an easy way to show that correlation three and a half years ago we went ahead and founded TrenDemon to help companies do just that.

    We connect their marketing efforts, which today rely mostly on content, you want your audience to consume valuable content, as opposed to just advertising. The big challenge is how do you attribute those efforts to sales? There’s actually a prior problem, how do you actually map the customer journey? How do you track those different touch points into one picture?

    Reverse Engineering Successful Customer Journeys

    The first thing we do is look at all the different touchpoints that a customer has had over his lifecycle. We ask the question, not just where do they come from, but how deep was their engagement? Did they actually watch the video? Did they actually read the article? Then you can start reverse engineering those successful journeys and say what’s common about all of these successful journeys.

    What we found, and this is the interesting thing, we’re working with over 90 companies today worldwide and the vast majority of content the companies produce, over 90 percent, is ineffective at driving business goals. As you guys know it’s very expensive to create quality content and it takes a lot of effort.

    If People Read the Right Content They Will Covert to a Sale

    The second interesting thing is that if you do manage to find those 10 percent and you find a way to get it in front of the right people you’re actually able to improve dramatically your results. So there’s not just a correlation between what buyers did beforehand, there’s also a causation, a causal relationship, that if people read the right content at the right time they’re more likely to follow a path. We’re not probably as sophisticated as we believe that we are.

    We’re a SaaS company, a cloud-based solution. We’re working a lot in the US and one of our biggest markets and growing markets is Japan. They’re investing a lot of content and a lot on technology. Essentially, because we look at the customer journey and not necessarily specific languages we can operate in any environment which allows us to grow pretty much anywhere. As long as they have content, which means that they’re producing something other than just advertising, they want people and audiences to actually engage with what they’re producing and they do have some business outcomes that they’re looking to measure.

    About TrenDemon:

    Founded in 2013, TrenDemon is the world’s leading content marketing attribution and optimization solution, helping marketers prove and improve their content’s impact.

    TrenDemon insights can help you uncover your content marketing ROI, impact on business goals, and engagement to help guide the content strategy. Our optimization units will help you increase conversions and shorten time to convert on your owned assets.

    TrenDemon proudly serves a wide range of customers, from Fortune 500s and brands to SaaS, B2B, and financial companies and is backed by leading VCs.

  • WordPress VIP Buying Parse.ly to Increase Enterprise Analytics

    WordPress VIP Buying Parse.ly to Increase Enterprise Analytics

    WordPress VIP (WPVIP), Automattic’s enterprise subsidiary, is buying Parse.ly to provide enterprise clients with content analytics.

    WPVIP currently offers enterprise-grade WordPress services to some of the biggest names in tech. Much of those services revolve around providing consultation, products and services to help clients get the most from WordPress.

    The acquisition of Parse.ly is a natural fit for WPVIP, adding powerful content analytics for the enterprise. WPVIP’s Nick Gernert highlighted some of the benefits:

    Over the years, we’ve been fortunate to see firsthand the impact of Parse.ly’s content analytics platform. Parse.ly isn’t simply capturing traditional traffic analytics. Instead, the platform goes deeper—revealing exactly how individual content pieces are impacting traffic in real-time. The upshot for content marketers? Rich reporting with detailed insights into the business impact of their content.

    With Parse.ly, the workflows that WPVIP customers use every day will surface insights that move beyond page views and visits. For example, commerce brands will understand which content converts visitors into buyers. They will also be able to deliver content recommendations for top-performing products.

    According to Parse.ly’s co-founder Sachin Kamdar, all of the company’s employees will now join WPVIP. Meanwhile, all of Parse.ly’s customers will gain access to WPVIP.

    Kamdar emphasized the further innovation that will result from WPVIP’s investment:

    Parse.ly’s open source WordPress plugin is already the most popular way to deploy Parse.ly to websites. And we have lots of ideas for how Parse.ly’s dashboard and API can improve enterprise WordPress sites. But, that’s not the only (or even the primary) place we’ll be innovating in 2021 and beyond. Our desire was always to make Parse.ly the top content analytics system on the market, and solve key real-time and historical analytics needs for editors, journalists, corporate marketers, and content marketers alike.

    With investment from the WPVIP team, and with wider product innovation support from the Automattic team, this dream will be a reality. You, our customers and prospective customers, will benefit directly from this investment.

  • Google Analytics 4: What You Should Know

    Google Analytics 4: What You Should Know

    Data analysis services like Google Analytics are critical for millions of businesses worldwide to understand their customers. It’s also a lucrative industry; by 2028, the data analytics market is expected to be worth $550 billion. The field has come a long way since the early days of the internet.

    The History of Web Analytics

    Web analytics is almost as old as the internet itself. Just 3 years after the internet came into existence, hit counters became available for use. Hit counters are familiar features to most internet users. They consist of simple code that displays the number of page views. Hit counters can be used without any kind of IT expertise.

    Slightly more complicated is log analysis, which helps people interpret server logs and identify traffic sources to their website. Yet as websites morphed from plain text to images, audio, and video, log analysis developed gaps in its data. That’s because caching, or temporarily storing a file in the system to avoid multiple HTTP requests was a common occurrence that wouldn’t show up on the log. Eventually, the gap was filled by JavaScript, which followed user behavior using a tag-based system. JavaScript could track more than just hits, which moved analytics into the field of marketing. 

    The Dawn of Google Analytics

    By this point, marketers were able to create targeted advertisements, optimize website copy, and more. Yet there were limits; in the late ‘90s, large companies could take as long as 24 hours to process their website’s data. Along came Urchin, a web analytics company that could process the same data in as little as 15 minutes. At one point, Urchin worked with 1 in 5 of the Fortune 500. Urchin continued its upward trend until Google bought them in 2005 for $30 million, giving birth to Google Analytics.

    Google Analytics is a service that ties in directly with Google’s web marketing offerings. They offer in-depth, tag-based data that focuses on the quantitative side. For the past decade, their most popular offering has been Universal Analytics, which launched in 2012. Universal Analytics lived up to its name by enabling the tracking of users across multiple devices and platforms. It can monitor offline behavior, and it combines demographic data with real-time monitoring for the most detailed consumer insights possible.

    Google Analytics 4 is Coming


    The expansive reach of Universal Analytics made it one of the targets of certain governments as they passed online privacy laws. One of the most well known laws of this nature is the European Union’s General Data Protection Regulation, or GDPR for short. In part as a response to the new regulatory environment, Google launched Google Analytics 4 (GA4) in October 2020. GA4 is in compliance with the GDPR in that it only uses first-party cookies and has a Consent Mode that adjusts data collected on users based on said user’s permissions. At the same time, GA4 has all the insight capacity of its predecessor.

    In Conclusion

    GA4 has added new features like debugging mode, consistent collection methods for mobile and web data, and cross-platform reporting opportunities. Is your website ready to switch?

    History & Future of Web Analytics
    Source: InfoTrust
  • Data Collection in a World of Internet Privacy

    Data Collection in a World of Internet Privacy

    The use of online tracking tools is one of the primary methods that businesses can use to inform their marketing efforts and therefore grow revenue. In order to do this, companies with an online presence most often use cookies and tags, also known as web beacons, to gather data about their consumers and their habits. Cookies are small text files that a website can place on a user’s device that enables them to recognize and track their online behavior. Similarly, tags are the technical mechanism by which cookies are stored on a user’s device, collecting data including but not limited to the pages they view, products they purchase, and how they accessed the website.

    Because of the expansive technology that businesses can use to gather personal data on their customers, there are many privacy regulations that have been put into place to protect the rights of the user when online, which may be part of why cybersecurity insurance rates are rising. For example, in Europe, ePrivacy Directive is the governing body of user experience and privacy, and secures one’s right to privacy in terms of online tracking, personal profiting, unsolicited marketing tactics, and nonconsensual data harvesting by third parties. Similarly, the General Data Protection Regulation (GDPR) addresses data protection regardless of data type, giving users multiple rights and powers over where and with whom their data is shared. In the United States, state-specific legislation gives users rights related to the processing of their personal information. California, Colorado, and Virginia are only a few of the many states that outline specific guidelines for how data and private information is handled.

    If too many users refuse to consent to sharing their data, businesses struggle to gather sufficient data and analytics may be rendered useless. When websites are unaware of the proportion of consenting users, what cohort is reflected in collected data, and if a sufficient sample is present to make accurate optimizations, it is increasingly difficult for businesses to make accurate inferences about user behavior. In addition, if these regulations are violated, there are heavy fines associated with non-compliance. In May 2018, the EU issued over 800 fines, and to date, big name companies like Amazon and Google have incurred millions of dollars in fines. It is tedious for users to read the consent agreement and give permission to a website to store their data, therefore a smaller proportion of users are consenting, leaving companies with insufficient information and a higher likelihood of fines and violations.

    There is now a new approach to online privacy law compliance that allows businesses to make the most of the data that they have in an ethical way. This measurement methodology involves collecting data anonymously without the use of cookies, and suggests that websites prompt users to provide a login or to register early in the user funnel. Both of these methods will allow for data collection in common scenarios where consent is not necessary or when it is given voluntarily under the guise of account creation with a certain business or web page. This data is vital to marketers and users alike, as it allows a company to make informed decisions about their user’s interests in the most ethical way, which is important to customers. Data in today’s world is so powerful, and it’s important to present the best tools to harness that power, lawfully.

    Data Collection in a Post-Cookie World
    Source: InfoTrust
  • How Heat Maps Can Be Useful To Your Business

    How Heat Maps Can Be Useful To Your Business

    The purpose of a heat map is to measure the density of data in a particular area. To differentiate different levels of density, heat maps employ various colors. In general, red and orange are utilized for higher densities and blue for lower densities. 

    Although other maps can measure data density, heat maps are a tidier way of doing so. For instance, a pin map displays density by identifying each datapoint with a marker. However, these maps can become messy and difficult to analyze. By contrast, a heat map makes it easy to identify areas where particular information is more prevalent in representing density with colors. For example, if you wanted to see where your sales are coming from, you would start by plotting all your sales locations. Then, by applying a heat map to this data, you would be able to quickly identify where sales are highest and where they are lowest. You can then use this information to make important changes to your sales strategy. 

    Types of Heat Maps

    There are three primary types of heat maps. These are: 

    Traditional

    This type of heat map represents data points as color-coded circles with a specific radius of influence. In general, the densest areas of these circles will be colored red and then fade to blue or green as the data becomes dispersed. However, most heat maps will allow you to choose colors to suit your preferences. 

    Area-Based

    If you want to compare data between one or more different geographic areas, you will use an area-based heat map. Geographic areas can be defined by either zip codes, counties, or states. These areas are then colored based on the amount of data located there. For example, if a large number of customers aged 30-50 live in the state of Illinois, it would be colored red. However, if only a few customers aged 30-50 live in the state of Georgia, Georgia would be colored blue. Consequently, you’ll get a quick overview of where these types of customers are located in the US. 

    Point-Based

    Often compared to dot-density maps, point-based heat maps use points to represent data. The larger the cluster of points, the higher density of data. The more sparse the cluster, the lower the density of data. 

    How Can You Use Heat Maps for Business

    There are a variety of ways that heat maps can be useful for your business. For instance, as previously mentioned, heat mapping is a valuable asset for planning your sales strategy. This is because heat maps demonstrate the strength of data’s presence in some areas and its absence in others. As a result, a business can gain valuable insights. 

    A heat mapping tool measures a business’s performance based on several key metrics. These include:

    • Revenue
    • Customers
    • Sales
    • Service calls
    • Deliveries 

    Taking revenue as an example, heat maps tell a company what areas bring in the most money. Businesses can decide what areas require more attention and what areas are already well served using this information. This can be particularly useful when designing a targeted marketing campaign. For example, for areas that bring in a great deal of revenue, the company might create ads that encourage repeat purchases. However, they might need ads that encourage new customers to trust their product or service for areas where revenue is low. 

    Another way to use heat maps is to employ them to manage salesperson distribution or delivery driver management. For example, by plotting your sales reps or delivery drivers and locations, you can see which territories have plenty of personnel and which are lacking. As a result, you can fill gaps and move people around to serve your customers better. 

    Lastly, heat mapping is a great tool for research. Heat maps can measure a vast array of demographic data, including:

    • Income
    • Housing
    • Gender
    • Population
    • Race
    • Age 

    Using this data, you can determine where your target audience is located, allowing you to plan strategic marketing campaigns and choose sites for new business locations. 

    Businesses that Heat Maps are Particularly Well Suited For

    While virtually every business can benefit from using a heat map to analyze its data, there are a few types of companies that heat maps are particularly well suited for. These are:

    • Sales
    • Healthcare/Medical professions
    • Finance
    • Franchises
    • Real Estate
    • Delivery businesses
    • Governments
    • Service businesses 

    Main Advantages of Using Heat Maps

    Heat maps are beneficial to businesses for many reasons, but let’s look at the advantages they provide in a little more depth. 

    Heat Maps Measure Performance

    To improve your company, it’s essential that you know which parts of your business are performing well and which are not. Using a heat map, you can determine where you’re hitting your targets and where you’re falling behind. With this information, you can compare business locations and territories to determine where you perform best and which areas need work. 

    Heat Maps Help You Understand the Market

    Developing a successful marketing strategy requires that you have a good understanding of the people you’re targeting. Therefore, a heat map is an excellent way to learn more about where your target audience is located based on demographic information. You will also learn more about who your customers are and how you can sell to them. Furthermore, a heat map can show you potential new areas for expansion. 

    Heat Maps Help Uncover Hidden Patterns

    Business data contains a lot of valuable information, but some of it might go unseen if not portrayed in the right manner. For instance, it can be hard to decipher patterns in geographic buying habits by looking at numbers in a spreadsheet. By contrast, if you were to visualize your data using a heat map, you can compare the buying habits of one area versus other areas.

  • Judge ‘Disturbed’ by Google’s Data Tracking

    Judge ‘Disturbed’ by Google’s Data Tracking

    U.S. District Judge Lucy Koh has expressed she is “disturbed” by accusations regarding the depth of Google’s data tracking habits.

    Google is facing a class-action lawsuit accusing the company of lying to its customers when it says it doesn’t track them in Chrome’s Incognito Mode. When Incognito Mode is active, the browser is not supposed to remember browsing history, filled out form data, cookies, site data and more.

    The lawsuit alleges that Google is leveraging code in its analytics platform — which is used on countless websites — to bypass Incognito Mode. This allegedly gives Google the ability to scrape data to piece together a profile of users’ browsing and habits.

    According to Bloomberg, Judge Koh was “disturbed” by the accusations. When Google tried to have the case dismissed, Judge Koh said it was “unusual” that Google would go to the “extra effort” to collect the data in question, unless it was using it to do the very thing Incognito is supposed to prevent.

    Google is facing multiple lawsuits, both for its privacy practices and for alleged anticompetitive behavior. A judge finding the company’s actions ‘distrusting’ is not a good look for Google.

  • How To Track Your Customer Journeys in Real-Time to Empower Your Sales Team

    How To Track Your Customer Journeys in Real-Time to Empower Your Sales Team

    The four pillars of measuring marketing ROI are key to improving sales says Jonathan Rowe, Chief Marketing Officer at nCino. “It’s really understanding your costs specific to the activities you are doing in marketing, tying those activities to your sales opportunities, and then measuring results.”

    Rowe says that taking in data on sales prospects and making it available to salespeople can drive results: “When you are bringing all of the data into one real-time place, then you can start empowering salespeople to use the data. You can track your customer journeys in real-time.”

    Jonathan Rowe, Chief Marketing Officer at nCino, discusses how to use data to track and improve marketing ROI in an interview with James Carbary, the founder of Sweet Fish Media on the B2B Growth Podcast:

    The Four Pillars of Measuring Marketing ROI

    Knowing Your Costs

    There are four variables that we use to measure ROI that have proven very successful for us. It starts with your costs. Whether it’s headcount costs where you are investing in people, whether it’s the cost of investing in PR, whether you are doing webinars or podcasts, whether you are advertising, etc., it’s really making sure that you have a good understanding of here’s where I’m actually spending my money and how much. So it starts with your costs.

    Identifying Marketing Activities

    The next step from there is here are all the different activities that we are spending money on. It’s advertising, attending conferences, or doing podcasts. Here are the activities. You have your costs and you have your activities.

    Connecting Activities to Sales Opportunities

    Then the next big step is connecting those activities to actual sales opportunities. As a B2B marketing organization at nCino, we are selling and marketing to banks. Whenever we initiate a conversation with a financial institution it often takes us 9-12 months from that initial interaction to hopefully when they become a nCino customer.

    Over that 12 months, there are hopefully going to be a lot of different marketing activities where that bank and different individuals at the bank interact with nCino. We want to be able to capture that information. So we take the activities that we are doing and we actually connect them to a specific sales opportunity at the financial institution and the individual at the financial institution.

    ROI: Measuring Results

    The fourth pillar is the results, where we actually turn that prospect into a nCino customer. Then we can say that marketing played this role. At the end of the day, we are in a business where it’s more than marketing. We have sales groups and others involved.

    When we sign a financial institution to become a nCino customer I’m always very proud to say here are all the different marketing activities (that led to the sale). Whether it’s white papers and thought leadership or press releases or attending a conference in a booth, how all those activities played an influential role.

    It’s really understanding your costs specific to the activities you are doing in marketing, tying those activities to your sales opportunities, and then measuring results.

    You Have to Be Committed to Data Analytics

    One, you have to really be committed to data analytics. You want to have that marketing driven organization knowing it’s going to take time and costs to get there. Then two, you want to make smart decisions around the technology you use because connecting all of the dots around your data is probably the most important thing. I want to be able to go onto two or three systems which are what we have at nCino and be able to look and see all that data together.

    I can see, for example, that Mary who works at a financial institution that we are talking to was on our website yesterday, that she looked at all of these different pages, that she spent seven or eight minutes on each page, and she actually downloaded one of our whitepapers. Then I find out that we are going to see Mary at a banking conference that we are going to in a few weeks.

    With all of that automation, I know that the salesperson will log in and see all of that information on the financial institution and Mary.

    Track You Customer Journeys in Real-Time

    That sales rep will have literally on their phone before they have that face to face conversation at the conference all of Mary’s interactions. Some things you probably don’t want to tell Mary, which is hey, by the way, we’ve been tracking all of your website activity on the nCino website. But what you can have is a conversation around the fact that she downloaded our artificial intelligence whitepaper around banking and you can talk about that.

    When you have fewer systems and you’ve made the commitment and you’ve gotten to the place where you are bringing all of the data into one real-time place, then you can start empowering people to use the data. You can track your customer journeys in real-time.

    >> Listen to the complete B2B Growth podcast interview.

  • Technology and Innovation Powering Levi Strauss Growth Strategy, Says CEO

    Technology and Innovation Powering Levi Strauss Growth Strategy, Says CEO

    Levi Strauss began trading on the New York Stock Exchange this morning under the ticker symbol ‘LEVI.’ By mid-afternoon, the stock was at $22.66, substantially higher than the price offered to institutional investors. It’s clear that investors believe that Levi’s can leverage technology and innovation to successfully compete online and in brick and mortar stores.

    Levi Strauss Soars in NYSE Debut

    Charles Bergh, CEO of Levi Strauss, discusses how technology and innovation are driving increased sales and market share in an interview with CNBC coinciding with their IPO:

    We Are Denim and We’re the Market Leader Globally

    We are denim and we’re the market leader globally. A lot of people as we were doing the (IPO) roadshow said aren’t you guys just riding the denim wave? We’re creating the denim wave. We’ve been driving the category with innovation across our men’s business and our women’s business. We’ve expanded to other categories. Last year we finished with 14 percent growth coming off of 8 percent growth the prior year. The business is really humming right now.

    I believe this is sustainable for the long term. Maybe not double digits forever. But we’ve got clear runway for growth across the categories that we’re competing in. We’re building share in our core categories and expanding to new categories. Last fiscal year, when we finished the year our growth was really broad-based. If you looked at it in the categories where we competed we grew every single category. If you looked at it by geography we grew every single geography. If you look at it by channel we grew across wholesale, including US wholesale, which is a little bit of a melting iceberg right now. We grew in our own brick-and-mortar and ecommerce. It was very broad-based growth last year and we’re confident we can continue that.

    We Have Built a Very Big Platform for Big Data

    First of all, to be successful it does come down to strong brands. Consumers at the end of the day love an emotional attachment with their brand. We’ve recreated that that love for Levi’s. We have built a very big platform for big data. In fact just a couple of weeks ago we announced that we’ve hired a head of advanced analytics and machine learning who will sit on the executive team and report directly to me. We are mining the data that we do collect and really turning it into revenue.

    Our strategies are working and one of the key strategic choices that we made seven years ago, shortly after I joined, was to become a leading world-class omnichannel retailer and it is working. The mix has shifted to omnichannel. When I joined the company it was about 20 percent of our business. Today, it’s almost a third. It is faster growing than our wholesale business and we’re continuing to invest in it. Most of our capital investment is going into retail and ecommerce and knitting that seamless consumer experience together.

    Implemented New Instance of SAP and Investing in RFID

    It (IPO funds) is going to go into continued investment in building out our omnichannel. So both brick-and-mortar retail as well as our ecommerce business and then knitting it together with technology. For example, we’re implementing a new instance of SAP and investing in RFID (radio frequency identification). We’ve implemented RFID across our business in the US and UK and that’s actually really turning into money. Every one of the products in our store is tagged with RFID.

    I’ve actually had this experience happen to me myself in our new Times Square store. There was an item I wanted to buy and they didn’t have it in my size. A stylist came over and scanned the tag and she could see that my size was available in the back room. Just two minutes later I was in the dressing room trying it on. A year ago before our RFID that would have been a lost sale. That just wouldn’t have happened. It gives us instant clear visibility to the inventory in our store, both in front of house as well as back of house.

    Levi’s Driving Market Share Through Product Innovation

    Back in 2013 and 2014, the headlines were the death of denim. It was all about athletic tights and Lululemon tights. It became a throwdown moment for us as a company. We have an innovation center a couple of blocks from our office. We brought our suppliers, the mills that make denim for us, into that innovation center. We understood what women were really telling us by wearing tights. That used to be a denim occasion. They wanted soft stretchy comfortable material that made them look great and gave them confidence. That was what was driving that conversion. So we innovated around soft stretchy comfortable denim which we can now do. We developed proprietary four-way stretch so that women don’t get baggy knees, which is their biggest dissatisfier.

    We relaunched our business in the middle of 2015 and we’ve grown 14 quarters in a row and in the last eight quarters at double-digit rates. It has been a huge part of our growth. We were under $800 million just on women’s bottoms about three years ago. We’re over a billion dollars today. We are number one globally with a nine percent market share, but we’re not number one in a number of markets including right here in the US. So I really do believe we can continue to grow at an accelerated rate on our women’s business. There are lots of what I like to call share donors out there for us to build share while we’re building the category.

    We haven’t seen any (backlash to being an American brand). This brand stands for everything good about America. Freedom, democracy, and allowing people to express themselves. Authentic self-expression is what the Levi’s brand is all about. We’ve not seen any backlash. None. We think there are lots of opportunities still for us. I am not worried at all about denim. We are denim and we’ll continue to drive this category through great innovation and marketing that connects with consumers and sends them into our stores.

    Technology and Innovation Powering Levi Strauss Growth Strategy


  • When It’s Game Time for Retail New Relic is There, Says CEO

    When It’s Game Time for Retail New Relic is There, Says CEO

    New Relic provides deep performance analytics for every part of a business software environment. It enables companies to easily view and analyze massive amounts of data, and gain actionable insights in real-time. Whether it’s for a popular mobile app, an online video game with millions of users, or a huge ecommerce platform, they all rely on critical New Relic insights to keep revenue flowing.

    Lew Cirne, founder and CEO of New Relic, talks about how critical real-time insights from New Relic are to a companies revenue stream in an interview with Jim Cramer on CNBC:

    When It’s Game Time for Retail New Relic is There

    For retail obviously, so much of their business, particularly their web business depends on a very small number of days; Black Friday, Cyber Monday, etc. That’s game time. That’s the moment of truth. That’s when we’re working our hardest to make sure our software is there to make sure our customers can see what’s going on in real-time. Our customers were thrilled with the performance and availability that they delivered which turns into business results.

    If your site is slower or down on Cyber Monday, forget it, you’re going to miss your quarter. You may never recover from that because you also have a brand hit. So it’s so vital. This is not nice to have software. Anybody who is competing on their software needs New Relic’s platform in order to succeed.

    We’re a Massive Cloud Operation

    We’re a massive cloud operation. We’re collecting millions of data points every second from mobile applications and from cloud infrastructure every time somebody’s pressing a button to buy something and every time someone’s watching this video on the CNBC app. We’re measuring the health of that and we do that on a massive scale. That’s one of the things our customers love.

    When Fortnite said, “Hey we’ve got this huge app. It’s the biggest in the world and we want to monitor on New Relic.” We’re like great. Your biggest day is just another day for us. We collect so much data and we can do it for you.

    New Relic Monitors Fortnite to Keep it Running for Millions of People

    Epic Games is the company that created Fortnite and if you have kids or you’re into games this game has taken the world by storm. It’s the most popular game in the world. If that game is not working millions of people know about it and the company is affected.

    So they rely on the New Relic platform to see everything in real-time on how that game is performing. It’s a very complex piece of software that has to work flawlessly in real-time. We measure everything going on in that game so that the builders of Fortnite can keep it running for millions of people 24/7.

    There are different companies that do different things around observing what’s going on in this space but were the applications-centric company. What does that mean? It means that when you’re playing Fortnite what you’re doing is you’re using software.

    We’re measuring the software in real-time. We do it in a cloud platform that integrates what’s going on in the software with the infrastructure and with the end-user experience, like the mobile app. We see all that together and do it in one unified platform and our customers love us for that.

    New Relic Helps CNBC Scale Mobile App in Real-Time

    At CNBC, you just launched an incredible new revenue app in the fall and it’s amazing. I use it a lot and I love it and again this is an app that’s getting a lot of uptake. I was talking to the team and they said customers love what the app is doing for them and they want to use it more and more. That means they have to scale.

    When more and more people are using that app how are you able to handle the scale when people want to see the news in real time and want to see the stock quotes in real time? We provide them the visibility that gives them the confidence to move faster and scale to this amazing demand that the CNBC app is generating.

    New Relic Helps Companies Move Fast in a Multi-Cloud World

    This is so important to our customers. It’s clear that we’re entering a multi-cloud world. Obviously, Microsoft’s doing well and Amazon doing very well. We had a great show at re:INVENT. And there’s some hybrid cloud as well. What our customers are saying no matter where my software is running I want to see it all in one place. I’m sick of moving from one tool to another to see a complete picture. They turn to the New Relic platform to see it all in one place. That enables them to move fast with confidence.

    Anywhere there are systems that need to perform well and scale well, those are systems that need New Relic. What we say to our customers is building great software is not easy, but it is the foundation upon which companies can build great competitive advantage. We want to partner with our customers to deliver amazing software that delights our customers and grows their business.


  • Starbucks Dramatically Increased Used of AI-Powered Customer Insights to Drive Growth, Says CEO

    Starbucks Dramatically Increased Used of AI-Powered Customer Insights to Drive Growth, Says CEO

    Starbucks has dramatically increased the use of AI-powered customer insights to drive growth, says Starbucks CEO Kevin Johnson. During the most recent holiday season, Starbucks made data-driven decisions on a variety of items from the type of holiday cups they were offering to how they promoted gift cards, all designed to increase sales. Johnson credits these new customer insights for improving gift card sales by four percent over last years holiday period.

    Kevin Johnson, CEO of Starbucks, discussed in an interview on CNBC how analytics, artificial intelligence, personalization, and technology are now driving marketing, sales, and business decisions:

    AI is Making Us a Better Company

    We have dramatically stepped up the focus on customer insight. We are using technology to help inform us of what customers want, what they need, and what they think of Starbucks. That informed our entire holiday plan this year, and we had a fantastic holiday.

    We are driving much more use of analytics, artificial intelligence, personalization, and technology to help us be more informed and more connected to our customers. That is making us a better company.

    Customer Insights Driving Starbucks Growth

    I’ll frame it around customer insights. Coming out of last year’s holiday we used a number of tools and research to give us customer insights on what customers really appreciated and loved about Starbucks at the holiday. That informed everything from the design of our cups to utilizing the reusable red cup promotion that we launched. We saw gift card sales grow four percent year-on-year in the quarter.

    That was a function of customer insight and research that we did. This holiday, in many ways, was informed by that insight. That’s just an example of what we’re doing. We’re using all kinds of data, customer focus groups, and things to help us be more informed and more front-footed on the trends and the things that customers really want to see from Starbucks.


  • Google Expands Functionality of Property Sets to More Sections of Search Console

    Google Expands Functionality of Property Sets to More Sections of Search Console

    In a response to many requests by search managers and webmasters, Google has expanded the functionality of the wildly popular property sets feature to more sections of the Search Console. Google launched property sets back in May allowing you to combine multiple properties (both apps and sites) into a single group to monitor the overall clicks and impressions in search within a single report.

    screen-shot-2016-12-13-at-3-00-44-pm

    John Mueller, Webmaster Trends Analyst at Google based in Switzerland explains:

    “For example, if you have multiple international or brand-specific websites, and perhaps even an Android app, it can be useful to see changes of the whole set over time: are things headed in the expected direction? are there any outliers that you’d want to drill down into? Similarly, you could monitor your site’s hreflang setup across different versions of the same website during a planned transition, such as when you move from HTTP to HTTPS, or change domains.”

    According to Mueller you can now “you can now just add any verified properties to a set, let the data collect, and then check out features like the mobile usability report, review your AMP implementation, double-check rich cards, or hreflang / internationalization markup, and more.”

  • New Features for Google Adwords: Campaign Groups and Performance Targets

    Google announced today new features in their Adwords product, campaign groups and performance targets, both intended to make it easier for you to track and forecast the performance of your marketing campaigns.

    Campaign Groups

    The new campaign groups feature allows you to group all of your Google ad campaigns including search, shopping, display and YouTube all into one campaign, making them easier to track and improve. Google is envisioning marketers using this grouping to track marketing themes across their network of ad opportunities.

    They gave an example of a theoretical campaign called “Holiday Launch” where you can easily link your YouTube advertising stats with your ecommerce and search data.

    Performance Targets

    The performance targets feature improves on your ability within Adwords to set goals and track clicks and conversions by campaign group. Combining performance targets with the new campaign groups feature lets you set target clicks and conversions across Google’s network of marketing platforms.

    “Tell us how many clicks or conversions you want to receive, how much you want to spend, and what average CPC or CPA you wish to maintain,” noted Jon Diorio, Product Manager of Google AdWords. “We’ll then automatically show you a single view of how your campaign group is performing against those goals, and what we think you’ll likely achieve by the end of the campaign period.”

    Picture 3

    Diorio said that these feature will not alter how Google serves your ads or optimize your campaigns, but simply offers advertisers better evaluation tools.

    Google let some advertisers try the new features prior to their public release today. “Previously I needed to export all my campaigns into a spreadsheet, group them together, and create a pivot table simply to see how they are performing,” said Oleg Monakhov, Senior Lead Generation Manager at Wrike. “With campaign groups & performance targets, we can much more easily see how our groups are performing relative to our goals, all from within the AdWords interface.”

  • Google Search Console Introduces ‘Property Sets’

    Google Search Console Introduces ‘Property Sets’

    Google has launched ‘Property Sets’ within their Search Console allowing webmasters to combine apps and sites within a single group in order to monitor overall clicks and impressions within a single report. It will be rolling out to all users over the next couple of days. This is a great feature for those that have many subdomains as well.

    Screen Shot 2016-05-23 at 8.22.51 AM

    Google provides these instructions to get started:

    1. Create a property set
    2. Add the properties you’re interested in
    3. The data will start being collected within a few days
    4. Profit from the new insights in Search Analytics!

    Google adds:

    Property Sets will treat all URIs from the properties included as a single presence in the Search Analytics feature. This means that Search Analytics metrics aggregated by host will be aggregated across all properties included in the set. For example, at a glance you’ll get the clicks and impressions of any of the sites in the set for all queries.

    This feature will work for any kind of property in Search Console. Use it to gain an overview of your international websites, of mixed HTTP / HTTPS sites, of different departments or brands that run separate websites, or monitor the Search Analytics of all your apps together: all of that’s possible with this feature.

  • Google Just Revamped the Google Analytics Mobile App

    Google Just Revamped the Google Analytics Mobile App

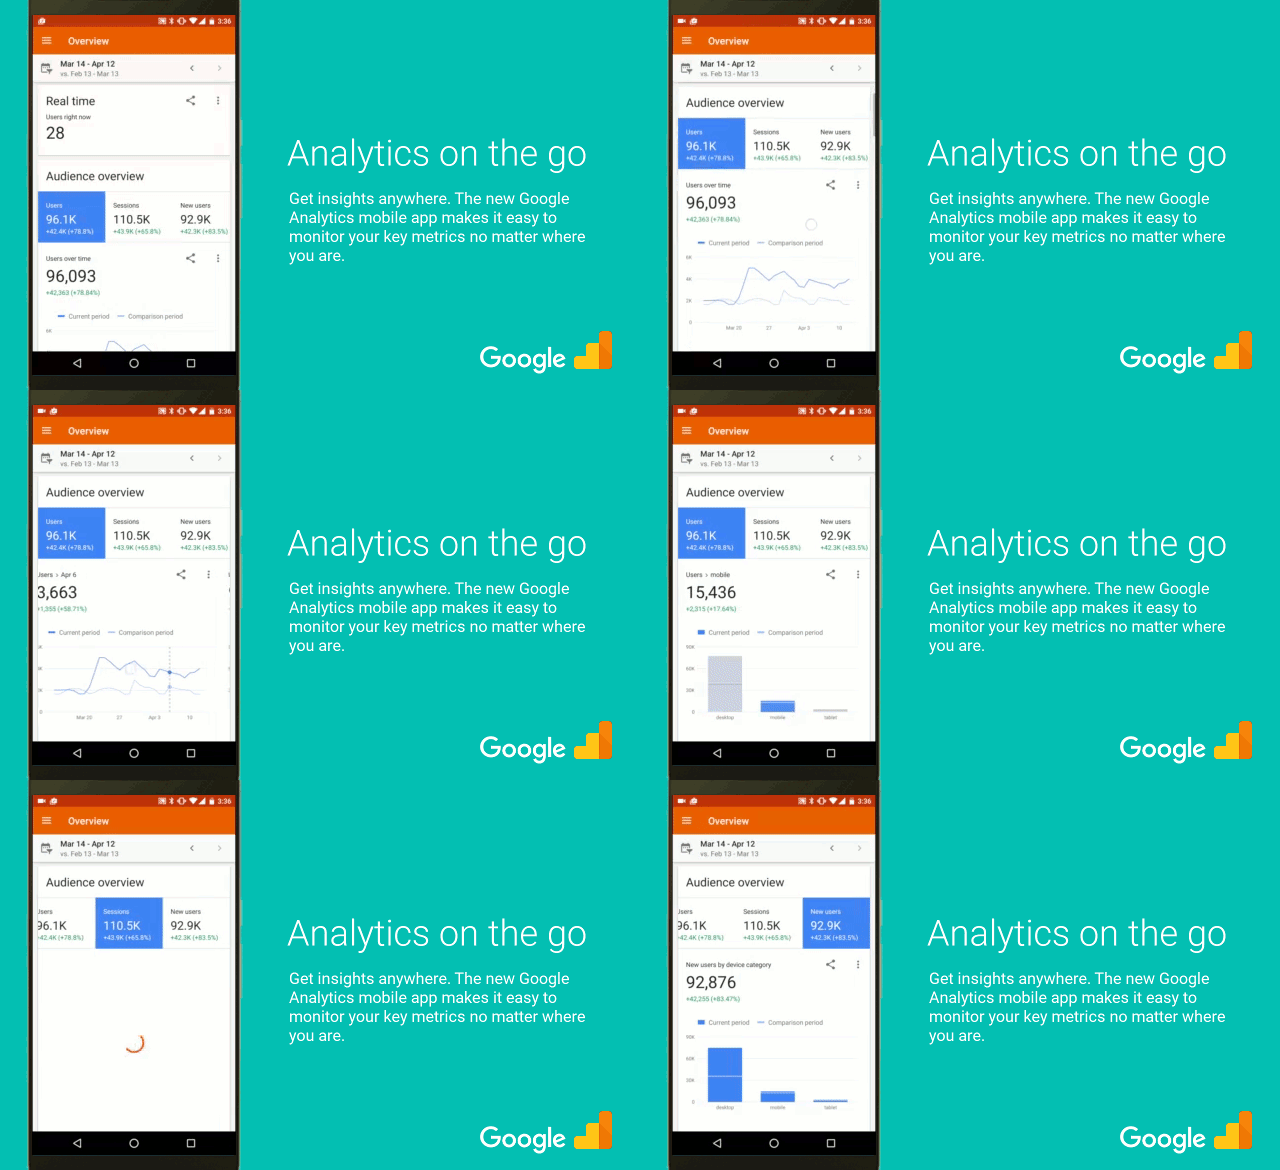
    Google released an update for the Google Analytics app on both Android and iOS, which improves access to a full overview of data and real-time business data, and lets you go deeper into reports with segments, customize your mobile dashboard, and share insights with others.

    Reports are simplified with a new format for small screens and enable users to track specific metrics that aren’t there by default by letting them modify a report quickly and saving it to the mobile dashboard.

    Items can be shared via email, social media, messaging, or anything else your device supports. Here’s a quick walkthrough:

    Images via Google

  • Google Analytics Adds User Explorer Reporting (And More)

    Google Analytics Adds User Explorer Reporting (And More)

    Google’s latest release notes for Google Analytics reveal some interesting new features including a new set of reporting called User Explorer Reporting. This lets customers anonymously analyze individual interactions to their site.

    Google explains in the notes, “User Explorer utilizes your existing anonymous Google Analytics data to deliver incremental insights helps marketers obtain valuable insights need to improve and optimize their site.”

    User Explorer can be found in the Audience sections. The report will surface Anonymous Client ID and User ID information including a history of activity. Marketing Land has a good look at the report.

    Also found in the release notes are: deeplinking into AdWords from the AdWords reporting section in GA; [Attribution 360] Data Studio integration; google-analytics.com traffic moved to SSL; [Analyics 360] custom tables: align regex interpretation; flexible auto-tagging override for GA-AdWords linking; AdWords final URL dimension; new sitelinks report in AdWords reporting section in GA; [Analytics 360] Add Experiment Fields to GA’s BigQuery Export; and Google Analytics Reporting API V4.

    Go here for descriptions on all of these item.

    Image via Google

  • New Facebook Video Crossposting Features Should Prove Helpful

    New Facebook Video Crossposting Features Should Prove Helpful

    Facebook made a ton of announcements on Tuesday. One that didn’t get quite as much as attention as some of the others could actually be one of the more useful ones for marketers.

    The company announced a new way for publishers to crosspost videos within and across Pages owned by the same Business Manager tool and total performance insights for videos. This will give you a single, aggregate view count for videos crossposted on different pages and an easy way to see the total performance of these videos.

    “Our publishing partners often like to create multiple Pages to engage different audiences on Facebook,” says product manager Anaid Gomez-Ortigoza. “Many of these partners reuse the same videos across different posts and Pages, and they’ve told us they’d like to see total performance insights for a single video across all the places it was used.”

    “For example, a media company might want to post a video on their main Page, their international Page, and one of their topical Pages,” Gomez-Ortigoza added. “Then they might also want to repost that same video a few weeks later.”

    In Business Manager, you can go to the new Permissions tab in the video upload or edit window to give other pages permission to reuse a video. After that, any page in that same Business Manager can create new posts with the new video without having to re-upload it.

    If a video is crossposted, the page owners of the page that initially uploaded the video will be able to see metrics for each post that included the video and aggregate metrics for the video across all posts. Page admins that reuse another page’s video will only see metrics for the posts they created and a Total Performance line that compares metrics on other posts to the video’s totals.

  • Facebook Adds Features To Analytics for Apps [F8]

    Facebook Adds Features To Analytics for Apps [F8]

    Last year at its F8 developer conference, Facebook launched Analytics for Apps. At today’s event, the company announced push notifications and deeper insights for the offering as well as a new interface and better performance.

    There’s a new People Insights section that provides aggregated and anonymous demographic info for those using your app without requiring you to implement Facebook Login. This will provide insights like Page likes, education, device usage, purchase preferences, etc.

    “Push and In-App Notifications (Beta) help you reach your customers and automate your marketing campaigns with targeted messages,” says Facebook’s Josh Twist. “In addition to regular push notifications that deep link to a specific place in your app, in-app notifications give you the option to create and customize richer push experiences with photos and animated GIFs. We’ve open-sourced in-app notifications to make them fully customizable and extensible.”

    “Sharing insights help you see the most popular stories shared from your website to Facebook, the aggregatged demographics of the people who shared them, as well as a sentiment analysis, top quotes and other insights,” he says. “Breakdowns let you pivot your data across multiple dimensions including age, gender, platform, country, language, app version and more. They’re a great way to explore your data and answer questions like ‘How much of my revenue is coming from a particular platform-operating system combination in a particular country?’”

    There are improved event trends to help you get a better handle on demographics and behavior of your audience over time and an App Events Export API to debut events and analyze data offline. This allows for access of up to the last 30 days of events.

    Over 450,000 apps have already used Analytics for Apps.

    Image via Facebook

  • Facebook Instant Articles Now Officially Open To All Publishers

    Facebook Instant Articles Now Officially Open To All Publishers

    Two months ago, Facebook announced that on April 12, it would open Instant Articles to all publishers. That day has arrived, and Facebook has made good on its promise.

    With the company’s F8 developer conference underway, the company announced that publishers of any type or size can now utilize Instant Articles. You can now go to instantarticles.fb.com to join the program.

    “More than one thousand publishers worldwide are officially part of the program, and at every step of the way, we see clear evidence that Instant Articles provides a better reading experience for people and a significant boost for publishers looking to reach their audiences on Facebook,” says product manager Josh Roberts.

    “Additionally for many people around the world, it’s challenging to get news on mobile simply because it takes too long to load,” he adds. “We’ve invested heavily in optimizing performance on Android, with the goal of providing the best mobile reading experience for people everywhere, no matter where they are in the world or what connection or device they’re on. In countries like India, Brazil, Mexico, the Philippines and others, we’ve found that people on slower connections read 20-40% more Instant Articles than mobile web articles on average as a result.”

    Facebook also announced new partners and tools for Instant Articles. Publishing tool partners now include WordPress, Drupal, Atavist, Medium, Perk, Distributed, RebelMouse, ShareThis, Sovrn, Steller, and Tempest. Analytics tool partners include Adobe Analytics, Chartbeat, comScore, Nielsen, Parsely, and SimpleReach.

    As previously announced, Instant Articles also now support branded content as a result of Facebook’s recent policy change.

  • Facebook Video Metrics Get Daily Breakdowns

    Facebook Video Metrics Get Daily Breakdowns

    Facebook is adding new daily breakdowns of metrics for videos to give Page owners a better understanding of how their videos are performing on a specific day. According to the company, this has been one of the most requested features.

    The addition of the new metric breakdowns follows last month’s launch of a simplified video metrics interface.

    You can now get daily breakdowns of Minutes Viewed, Views, and 10-second views.

    “These new metrics are available through Page Insights and your Video Library,” the company says. “In either interface, click on the video you’d like to see metrics for, and you’ll find them in the pop-up card. These metrics will be coming to the Insights API soon. We’re listening to feedback and will continue to improve the video metrics we offer to Page owners.”

    For some Facebook video trends to consider, read this.

    Images via Facebook

  • Twitter’s Crashlytics Gets Velocity Alerts

    Twitter’s Crashlytics Gets Velocity Alerts

    Twitter’s Crashlytics announced the launch of Velocity Alerts, which are designed to alert app developers about the most critical issues happening in their apps so they know when they really need to take action ASAP.

    For the alerts, they combine your app’s crash data with usage analytics from Answers, the mobile analytics tool added to Crashlytics a couple years ago.

    “Now, once you’ve enabled Answers as part of Crashlytics, our system will proactively check to see if there is a statistically significant number of sessions that have ended due to a crash related to one issue on a particular build,” writes Jason St. Pierre on the Crashlytics blog. “If so, we’ll let you know if that issue is a hot patch candidate and needs your attention immediately right on your dashboard. You’ll also get an email alert in your inbox as well as a push notification if you’re using the Fabric mobile app (Android support coming soon). With Crashlytics, you’ll never miss a critical bug!”

    Notification emails have also been redesigned to make important information more clear and actionable.

    Images via Crashlytics

  • Salesforce Launches Wave for Community Cloud

    Salesforce Launches Wave for Community Cloud

    In 2014, Salesforce launched Community Cloud, propelling itself into the fast-growing enterprise collaboration market. Last year, it launched Wave Analytics.

    Now, the company is introducing Wave for Community Cloud, which gives businesses analytics tools that can be applied across their partner ecosystems.

    “We’ve heard it before: Selling is a team sport,” says Salesforce’s Jamie Domenici. “Companies across the manufacturing, high-tech, consumer packaged goods, financial services industries and more rely on an extensive network of resellers, distributors, brokers, franchises and agents to drive growth. In fact, thousands of Salesforce customers are already using the Salesforce Community Cloud to better manage relationships and foster collaborative selling, planning and knowledge sharing amongst their channel partner ecosystem. And they’re seeing results — Community Cloud customers report an 86 percent increase in cross-sell and upsell opportunities. Now with Wave, customers can further extend the power of Community Cloud by arming partners with the same sales insights that a company’s own reps leverage to accelerate growth.”

    “Wave for Community Cloud enables customers to embed Wave Analytics dashboards into any Partner Community, providing channel partners with the insights they need to optimize sales,” Domenici adds. “Previously, partner managers couldn’t see all of their data in one place and would spend time reconciling spreadsheets or searching disparate systems looking for insights on what worked in the past. And worse, partner sales reps would often be left guessing which deals to focus on or wasting time following up on the wrong opportunities. But when armed with personalized, data-driven sales insights, channel partners are able to unlock new sales opportunities and close deals faster, as if they are a true extension of a company’s sales team.”

    You can check out a demo here:

    According to the company, the offering will help channel partners better understand their own business by way of interactive performance summaries and historical trends. Dashboards can utilize data from any source, and security permissions can be personalized for visibility on a partner-by-partner basis.

    Image via Salesforce