WebProNews

Category: B2BMarketingTrends

B2BMarketingTrends

  • If This Works For Twitter, Businesses Stand To Benefit

    If This Works For Twitter, Businesses Stand To Benefit

    It looks like Twitter is betting big on its recently launched Moments feature to help it grow its user base, which continues to grow at the rate of a snail’s pace. Whether or not marketers are able to benefit directly from the feature, everyone stands to gain something out of Twitter increasing its user base.

    Will Moments finally help Twitter kickstart its growth and benefit businesses using the platform for marketing purposes? Share your thoughts in the comments.

    The company is getting a lot of attention for running a television ad during the World Series. It’s not the first time Twitter has advertised on TV (that was in 2013 during a NASCAR race), but it’s not something the company has been doing regularly.

    Under constant pressure from shareholders and industry analysts (not to mention the ouster of CEO Dick Costolo) to pick up the pace on growth, Twitter is trying its damnedest to launch more products and features and make it easier for the general public to understand what they’re missing out on by not using Twitter.

    The new ad focuses specifically on Moments, as did a conference call held to discuss Twitter’s Q3 earnings release on Tuesday to a great extent.

    Just What Are Twitter Moments?

    Twitter unveiled Moments earlier this month. Basically, moments are curated stories made up of tweets, images, vines, videos, and GIFs. They are curated by Twitter and by select partners, which include Bleacher Report, Buzzfeed, Entertainment Weekly, Fox News, Getty Images, Mashable, MLB, NASA, New York Times, Vogue and the Washington Post. The number of curators will expand over time.

    Twitter users can access and follow specific stories from the new Moments tab, which features a lightning bolt icon. New stories appear throughout the day and are continuously updated and organized by topics like entertainment, sports, etc.

    For now, the feature is available to U.S. users on Android, iOS, and the web. Users outside of the country can view moments if someone shared one with them.

    Promoted Moments

    It didn’t take long for Twitter to turn Moments into a potential ad product. This was no doubt the plan from the beginning, but it took the company a couple of weeks to mention that part.

    Promoted Moments made their debut this past weekend. This is a new native ad format that it is now testing with certain partners.

    “We’re seeing how powerful this experience can be for diving into meaningful narratives — and since Twitter’s inception, brands have told some of the very best stories on the platform,” said Twitter brand strategy manager Bobby Grasberger. “Promoted Moments, like all of our ad products, will look and feel just like all other Moments — except they’ll be authored by a brand and be featured in the Moments guide for 24 hours, with a Promoted badge.”

    The first one came from MGM, Warner Bros, and New Line Cinema for the movie Creed. The ad debuted on Twitter on Sunday.

    Why Twitter Thinks Moments Will Work

    As mentioned, this is not a feature that Twitter is taking lightly. A great deal of the earnings call dealt with Moments, which CEO Jack Dorsey referred to as “the best of what’s happening on Twitter in an instant” and the “simplest way to see what’s happening in the world, all organized by topic.”

    He noted that it’s still early and the company is collecting feedback on the feature, but that they’ve already seen how it has improved Twitter. He went on to talk about the Moment for the Toronto Blue Jays series clinching win over the Texas Rangers during the playoffs, which he said showed the best places, commentary, and passion from fans after a go-ahead home run.

    Dorsey also talked about The Washington Post Paris Fashion Week Moment, which he said put people front row for designs fro a premiere fashion event as well as Mashable’s Moment of the South Carolina floods, which he said “brought home in a very visceral way the extent of flood damage” and how residents recover.

    He also noted how Moments are not only on Twitter in the Moments tab, but that they’re embedded all over the web, and that’s always been a key component of visibility for Twitter content.

    Even before Twitter let users embed tweets, the media would display images of Tweets, whether on television or in web articles.

    Dorsey said Twitter’s focus with Moments is currently to make them easier to discover and get people into them right when they open Twitter. Hence the TV ad.

    Rolling the feature out beyond the U.S. is also a priority.

    “Moments is just the start of bolder simplification efforts you will see on Twitter,” Dorsey said during the call. “I’ve challenged our teams to look beyond assumptions about what makes Twitter the best play to share what’s happening. I’m confident our ideals will result in the service that’s far easier to understand and much more powerful.”

    COO Adam Bain said that in Q4, Twitter will be opening up a new video focused inventory with the launch of Promoted Moments.

    “It’s designed to be a great platform for marketers to tell their stories, especially video centric narratives,” he said, noting that last weekend’s Creed campaign generated awareness and anticipation of the film by curating videos and tweets.

    The goal for Promoted Moments, he said, is to learn alongside marketers. According to Bain, demand for the format is strong and the company will be “deliberate” in its approach with a limited series for “quality consumer experience above all else.”

    During the testing phase, consumers will not see Promoted Moments every day.

    Twitter CFO Anthony Noto noted that the company is excited about the potential of Moments as “a fully integrated launch across all cross-functions”. This, he said, is something the company has been saying it needs to do in order to “capture the next cohort of users to use Twitter.”

    “Specifically we want to not just with engineering product and design but also an integrated team across marketing, coms, content and media,” he said. “If you’ve been online or on mobile, you’ll see your digital video ads, you will see our paid search ads, you will see our display ads and more to come on the marketing and content and media front. So we’re excited about all of those things and opportunity Moments brings to simplify our product and make it much easier to communicate our marketing.”

    Noto said Twitter has “opportunities to optimize across marketing channels and content quality and our choice and selection on content.”

    “The one other thing I’d just point out from a metric standpoint and I want to make sure investors really appreciate this point is Moments by itself is simplifying our product, but there are many features within Moments that leverage the strength of Twitter, the social aspects of Twitter and the strength of our open communication network,” Noto continued. “So the retweet, the share, and the favorite, you can retweet, you can share, and you favorite within Moments and what that does is it provides content back to all your followers in their home timeline enhancing their experience. So Moments is about driving adoption without a doubt and engagement, but it’s also about reinforcing the quality and strength of every node in our network and so we’re also focused on those things.”

    Dorsey chimed in again, “Moments represents a real fundamental shift in our thinking and the reason why is a lot of Twitter is organized by a reverse chronological timeline. We make people do a bunch of work to find the right accounts to follow and then they actually see the world through those accounts. What Moments does is you can open it up, you can actually see everything that’s happened in the world, that’s most meaningful, it’s organized by topics, so you see topics first. You tap in to each one of those Moments and you can actually see really unique insight and commentary on the particular event that you’re interested in.”

    He later referred to Moments as “one of those bold new experiences that I think does question a bunch of our fundamentals around making Twitter a whole lot easier to understand.”

    As far as Moments rolling out to the rest of the world, Dorsey said the company has an international rollout strategy for the product, but that it doesn’t want to pre-announce any markets. He said they just want to get it to everyone in the world as quickly as they can.

    “What I will tell you is that we want to build in the learnings from our launch in the U.S. and do it in an integrated way, the way we have in the U.S. in each one of those markets, so more to come,” he said.

    According to Noto, Moments is only the first of other product changes on the horizon that are fundamental to attracting more users and simplifying Twitter.

    Twitter is claiming 307 million monthly active users in Q3. That’s only a gain of 3 million from Q2.

    If Twitter can kickstart growth, it means more eyeballs for businesses on Twitter whether than means more followers or more visibility for promoted tweets, not to mention increased potential for any ecommerce endeavors – another area where Twitter is finally growing.

    Do you believe Twitter can convince more people to start using its services with Moments and other product launches? Do you think businesses will benefit from a growing user base? Discuss.

    Image via Twitter, Earnings call quotes via SeekingAlpha

  • As Instagram Surpasses Twitter, Marketers Must Take Note

    As Instagram Surpasses Twitter, Marketers Must Take Note

    Instagram is officially bigger than Twitter, and it has the power to let marketers target audiences at the same level as its parent company Facebook. If you’re not taking it seriously as a marketing channel yet, what are you waiting for?

    How have you leveraged Instagram in your marketing efforts? If you haven’t, what is holding you back? Discuss.

    Last week, Mark Zuckerberg and Instagram announced that the image and video sharing service has surpassed the 400 million monthly active users mark. It has added 100 million just since December.

    As Instagram rapidly grows its user base, it is also becoming a more accessible marketing platform to businesses of all sizes. Earlier this month, the company announced it is opening up its ads to all starting this month with launches around the world on September 30. The ads utilize Facebook’s ad infrastructure and targeting so marketers can target users based on well-established interests.

    “Businesses of all sizes have been testing these new capabilities this summer with positive results, and we’re seeing significant demand, particularly in areas like e-commerce, travel, entertainment and retail,” Instagram said in a recent blog post. “We’re thrilled to see what brands can achieve in the months ahead using Instagram as their creative canvas.”

    With Instagram going so far as to surpass Twitter in active users, one has to imagine that businesses will only just be getting started when it comes to both paid and organic promotion.

    “While Instagram may be a relative newcomer on the social media scene, there’s a strong business case for it becoming a part of your marketing strategy,” says Jayson DeMers at Forbes. “For instance: Did you know that at last count, nearly 28% of the US population uses Instagram, and that nearly half of all US adult users use it daily? Instagram is also beneficial from a revenue perspective, with the average order value from referrals being $65; this is second only to Polyvore’s $66.75.”

    It’s worth noting that while so many in the U.S. use Instagram, 75% of its user base lives outside the country. Among the last 100 million join, Instagram says, over half live in Europe and Asia. Brazil, Japan, and Indonesia are the countries that added the most.

    “Instagrammers continue to capture incredible photos and videos from all corners of the earth (and even the solar system),” the company said. “We’ve seen the first surface image of Pluto and the Champions League celebrations, as well as striking locales like the white pools of Turkey and a Namibian desert ghost town. These are just a few of the more than 80 million photos per day shared on Instagram.”

    As it’s still early days, marketers have a lot to figure out with Instagram and a lot of testing to do. Sure, some have attempted to crack the science, but with ads only just becoming available to all, not to mention increased competition among marketers, things are only going to continue to evolve, just as they have with Facebook.

    David Kirkpatrick at MarketingDive writes, “Devising when is the best time to post on social media is notoriously tricky. Mavrck analyzed 1.3 million Instagram posts and found more posts went up in the afternoon and evening, and suggested marketers looking for engagement might want to take advantage of the morning hours before noon. During this time users still monitored their feeds but weren’t actively posting themselves.”

    Instagram has so far been limited when it comes to B2B use, but a few months ago we looked at a report from Social Media Examiner indicating that 40% of B2B marketers intend to increase their Instagram activity.

    Do you see Instagram as an important part of your online marketing? Share your thoughts in the comments.

  • Infographic Looks At Stages Of B2B Digital Marketing Journey

    Infographic Looks At Stages Of B2B Digital Marketing Journey

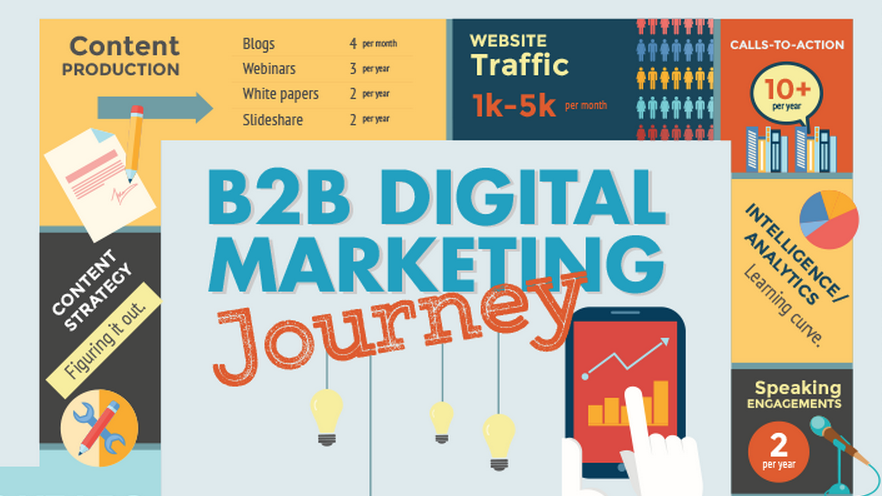
    Find and Convert released the following infographic earlier this year, but it was just brought to our attention by a post at Social Media Today. It looks at the B2B Digital Marketing Journey, breaking it down into three main stages.

    While the graphic is based on anecdotal experiences from a digital marketing agency with B2B clients rather than research findings, it’s an interesting look at the similarities and differences of marketing depending on the age of a company’s digital marketing experience.

    Find and Convert CEO shares his thoughts about the information presented in a blog post here.

    Image via Find and Convert

  • Here’s Your Guide To Getting More Out Of LinkedIn Ads

    Here’s Your Guide To Getting More Out Of LinkedIn Ads

    LinkedIn’s Sponsored Updates have been available to all advertisers for two years now. As more and more online marketers look to the professional social network to expand their reach, these are likely to become a bigger part of the marketing mix.

    LinkedIn now has an ebook out looking at “10 Ways to Drive Killer Results with Sponsored Update,” which you can download for free.

    It goes well beyond a list of ten tips to include plenty of data, charts and additional advice. Here’s an example of the kind of stuff you’ll find:

    Screen Shot 2015-08-26 at 4.27.13 PM

    In announcing the ebook, LinkedIn’s Selin Tyler says:

    Content marketing is simple in theory: Professionals love reading good content. Why not create branded content to help them in their buyer’s journey while effectively introducing them to your brand and offerings?

    Because it is such a simple and attractive concept, 98% of B2B marketers say it is core to their marketing strategy. Yet only four in ten think that their efforts are effective. So while the concept is so simple, execution is everything.

    The guide gets into how to tailor your content to your audience, create effective campaigns for conversions, and extend the shelf-life of the content you have.

    Image via LinkedIn

  • New Study Looks At Email Open Rate Factors

    New Study Looks At Email Open Rate Factors

    Email marketing software company Constant Contact just released a new study looking at open rates, finding that subscriber email domain and industry are major factors. According to the firm, segmented, personalized subscriber lists see higher open rate success and mobile devices now make up over half of all opens.

    The study pulls data from over 100 billion emails sent from Constant Contact this year and last.

    According to the study, personalized campaigns can result in open rates being raised by 150%. Those sent to 35 people or less (which suggests a more personalized campaign) saw open rates of 55% compared to the average rate of 22%. Those sent to over 7,500 subscribers (lower personalization) averaged about 14%.

    “This study provides conclusive proof that personalizing the emails you send, so that you’re speaking directly to specific interests and wants of a subscriber, not only strengthens the relationship with subscribers, it results in better campaign performance,” said Constant Contact chief analytics officer Jesse Harriott. “Small businesses tend to be great at developing authentic customer relationships and this data underscores the marketing value of those relationships.”

    As mentioned, the study found subscriber domain to play a significant role. It found that campaigns sent to Comcast, Verizon, and Cox email addresses had the highest open rates. AOL, Hotmail, and Yahoo addresses were at the opposite end of the spectrum.

    Screen Shot 2015-08-25 at 3.46.28 PM

    It also found that nonprofits get higher click-through rates than B2C and B2B campaigns. They also get better open rates. The average is 29% compared to 23% for B2C and 20% for B2B.

    Screen Shot 2015-08-25 at 3.47.28 PM

    Here’s a look at industry:

    Screen Shot 2015-08-25 at 3.49.37 PM

    “Whether it’s a religious organization or school, nonprofits generally have a passionate and engaged subscriber base that enjoys seeing regular updates and communications,” said Harriott. “However, the data also shows that—with the right type of execution—it is possible for businesses to replicate that kind of engagement. For example, if a fitness center keeps tabs on which exercise classes their members have taken in the past, sending relevant upcoming class schedules to the right members will inevitably result in higher open rates and well attended classes.”

    51% of all emails are opened on either a smartphone or tablet, the study found. 38.8% are opened on a smartphone and 11.9% are opened on a tablet.

    “Constant Contact has found that three-quarters of subscribers say they will delete an email if they can’t read it on their mobile device,” said Harriott. “When combined with these recent mobile open findings, the conclusion is clear: Small businesses must have a mobile-first mindset when it comes to their email marketing.”

    Earlier this year, we looked at what various professionals from the industry think it takes to improve email open rates. You can read that here. Also check out this infographic running down ten tips for doing so.

    Image via Thinkstock

  • Infographic Shows A Lot Of Helpful Pinterest Stats For Marketers

    Infographic Shows A Lot Of Helpful Pinterest Stats For Marketers

    Last week, we looked at Ahalogy’s recently released 2015 Pinterest Media Consumption Study,which includes a ton of interesting stats about how people are using it. It literally runs through the who, what, when, where, and why. They polled over 1,000 people and determined that 82% are female and 18% are mail, but that men on Pinterest have increased 4% since 2014, for example.

    The company has also released an infographic (via SocialMediaToday) showcasing a number of helpful findings that can help marketers shape their own Pinterest strategies.

    pinterest-info

    You might want to take a look at the profiles of those top ten brands people want to follow and get an idea of the kinds of things that are working for them.

    If you’re a B2B company, read this.

    Image via Ahalogy

  • What To Do And What Not To Do On LinkedIn

    What To Do And What Not To Do On LinkedIn

    LinkedIn has 347 million users and reaches 200 countries and territories. Just for comparison, Twitter has 316 million monthly actives.

    What strategies and/or tactics have you had success with on LinkedIn? What do you see businesses doing that they should stop? Share your thoughts in the comments.

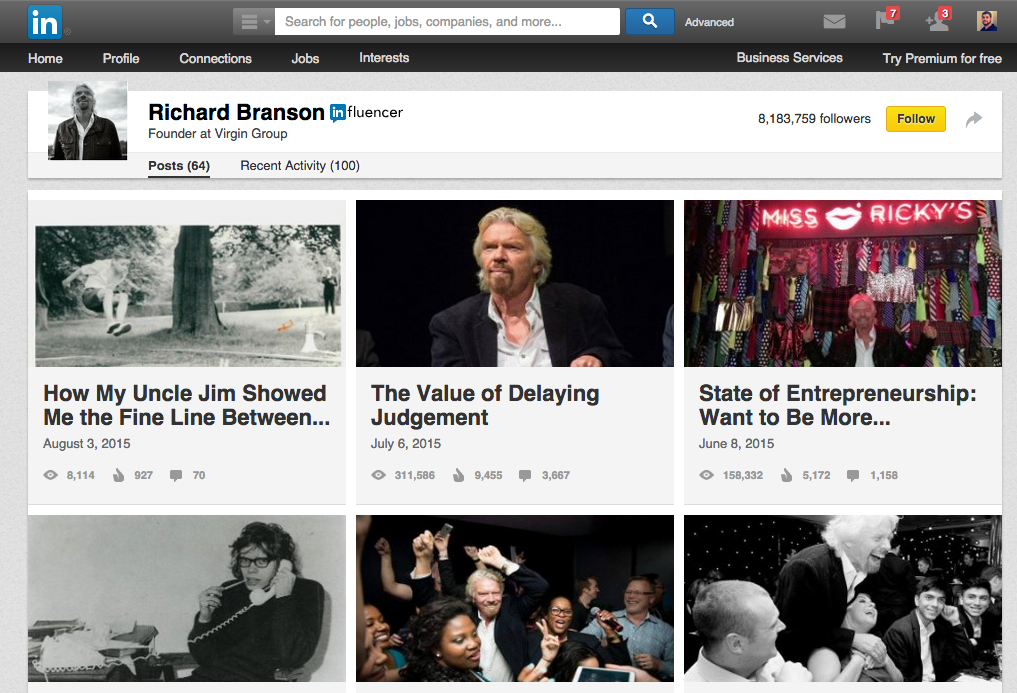
    40% of LinkedIn’s users check it daily, and it’s the most popular social network among CEOs running the top 50 companies in the Fortune Global 500. A new infographic from Salesforce Canada runs down these and other interesting stats about the professional network and some important dos and don’ts for businesses.

    Among the “dos” are treating your profile like a professional brochure, providing a detailed description, using simple language, spell-checking turning off notifications when updating your profile, linking to valuable video, choosing your group wisely, being active in groups, nurturing relationships, etc.

    On the “don’ts” side of things, it gets into connecting without researching, using the default message, sending spammy messages, posting faulty links, self-promoting, etc.

    dos-and-donts-of-linkedin

    We recently looked at some developments at LinkedIn that are making it more appealing for businesses for marketing and sales, especially for B2B companies. Among these are the extension of ads to publisher sites, changes to its Pulse news service that better utilize the user’s personal network, and sales tools like new Sales Navigator features and the new Social Selling Index, which kind of lets you know how well you’re doing in terms of the aforementioned do’s and don’ts.

    “SSI is the metric LinkedIn developed to help sales professionals benchmark their performance across the 4 pillars of social selling in order to better connect with leads, and ultimately close more deals,” a LinkedIn spokesperson told us. “While the concept of SSI has existed for some time, this is the first time that anyone will be able to log on to LinkedIn and access a score, any time.”

    While it may be aimed at sales professionals,it’s available to all users and gives you a good idea of how you’re doing in your LinkedIn efforts in general. To get better at LinkedIn, you’d probably do well to work on bringing that score up, just because it’s a good indicator of those efforts.

    What are the biggest mistakes you see businesses making on LinkedIn? Share your thoughts in the comments.

    Images via LinkedIn, Salesforce Canada

  • Here’s How LinkedIn Is Getting Better For B2B Sales And Marketing

    Here’s How LinkedIn Is Getting Better For B2B Sales And Marketing

    LinkedIn is the best social media platform for engaging with B2B customers both before and after making a sale, according to new research. As studies have shown, the professional network is only growing in importance to marketers, but in the B2B space, it’s the most important social network of them all to a lot of businesses.

    Is LinkedIn a major component of your marketing and/or sales efforts? Let us know in the comments.

    A recent study from Social Media Examiner looked at how marketers are using social media to grow their businesses. It didn’t focus exclusively on LinkedIn, but there are a lot signs within it that point to a bigger focus on the network as time goes on.

    When allowed to select just one social platform as the most important, 52% of marketers picked Facebook, but 21% picked LinkedIn. It takes the number three spot in terms of those actually being used:

    It’s also in third place behind Facebook and Twitter in platforms used by those with less than twelve months experience. As you’d expect, LinkedIn gets more importance placed on it by B2B marketers. Those focused on B2C are placing more emphasis on Facebook, YouTube, Pinterest, and Instagram, while B2B marketers are focused on LinkedIn, Twitter, Google+, and SlideShare (which LinkedIn acquired).

    For B2B, LinkedIn completely dominates the pack:

    In terms of overall importance to marketers, LinkedIn increased to 21% from 17% since 2014 as Facebook decreased slightly. For the self-employed, LinkedIn scored 23% just behind first-place Facebook (44%).

    The study also found that 66% of marketers plan to increase their use of LinkedIn in the future. As you’d guess, B2B marketers are more likely to plan on increasing their use. 80% of B2B marketers plan on doing so versus 56% of B2C marketers. 71% of B2B marketers are interested in learning more about LinkedIn as are 55% of B2C marketers. It’s the number two network behind Facebook when it comes to what marketers want to educate themselves about.

    18% of marketers are regularly using LinkedIn ads, the study found. That’s actually down from 20%. Still, 29% plan to increase their us of LinkedIn ads.

    Regalix recently put out its B2B Social Media Marketing 2015 report (via eMarketer) finding that LinkedIn is second only to Twitter as the most used social platform by B2B marketers. Both were significantly ahead of Facebook. All three were well ahead of everything else.

    Screen Shot 2015-08-03 at 5.07.26 PM

    LinkedIn is actually on top of of the list when it comes to channels found to be most effective for customer engagement both before and after sales.

    “LinkedIn (64%) and Twitter (47%) were the most favoured channels for customer engagement during the pre-sale stage of the buying cycle; they led the pack for the post-sale stage of the buying cycle too, but at lower figures with LinkedIn at 51% and Twitter at 42%,” the report says. “Facebook found greater preference among marketers for post-sale customer engagement (30%) than it did for pre-sale (17%).”

    Screen Shot 2015-08-03 at 5.12.42 PM

    Screen Shot 2015-08-03 at 5.13.25 PM

    LinkedIn recently extended its ads to publishers sites via LinkedIn Network Display. According to the company, these ads enable marketers to reach a “high-value audience of business professionals” both on and off LinkedIn, while targeting the right people to increase brand awareness with those “who matter most”. You can also track the impact of the ads with its campaign and website analytics.

    Looking at content types, the Social Media Examiner study found that 69% of marketers plan on increasing their use of blogs. This could further fuel LinkedIn marketing efforts as its publishing platform, which is essentially a blogging platform, is growing at a healthy clip.

    The company announced last month that over a million people had published a post using the platform. They first opened it up to everyone in February of last year. The company says over a million unique publishers publish over 130,000 posts a week, and about 45% of readers are in the upper ranks of their industries, such as managers, VPs, and CEOs. The average post now reaches professionals in 21 industries and 9 countries, it says.

    Just today, LinkedIn announced that it’s expanding the publishing platform globally, opening it up to more languages.

    “As professionals, we all have our own perspective on the world around us, but until recently, we didn’t always have the right platform to share it on,” said LinkedIn’s Angela Yang. “That’s why it came as no surprise that when we made it possible for all English speaking members to publish long-form posts on LinkedIn, it quickly became one of the fastest growing features on the site.”

    In June, LinkedIn launched a new version of its Pulse news reader app, which makes use of the user’s LinkedIn network when determining what content to show them. This should only help with LinkedIn content marketing efforts.

    On the sales side of things, LinkedIn is rapidly launching new features to accommodate. In June, it expanded its Sales Navigator tool and added Microsoft Dynamics CRM integration. It’s making its Slideshare product better for lead generation, and this week, LinkedIn gave users a new sales metric called Social Selling Index. All users get their own score to determine how effective they are at establishing their professional brand, finding the “right people, engaging with insights, and building relationships.”

    ssi

    “We know that social selling is a vital component of success for many sales organizations: salespeople who excel at social selling are creating more opportunities and are 51% more likely to hit quota,” says LinkedIn’s Lauren Mullenholz . “It is because of this massive potential that measurement of social selling efforts is all the more important. Empowering salespeople with the knowledge of where they stand with social selling can help them set clear goals and inspire them to become a better social seller.”

    The score is updated on a daily basis regardless of whether or not your’e an actual salesperson.

    Are you placing increased emphasis on your LinkedIn marketing efforts? Do you expect to as time goes on? Share your thoughts about marketing on the professional social platform.

    Images via LinkedIn (Flickr), Social Media Examiner, Regalix

  • LinkedIn Publishing Platform Makes Global Push

    LinkedIn Publishing Platform Makes Global Push

    LinkedIn just announced that its publishing platform is going global with localized languages. It’s only been available in English until now, but today it’s becoming available in Portuguese. In the coming months, it will add more and more languages. German and French are next up on the list.

    As it expands into more languages, it will also feature Influencers in each one. That starts with nearly two dozen in Portuguese right away.

    “Over the past few weeks we’ve given early access to some of our members in Brazil, and we’re already seeing thousands of high-quality posts making their way onto LinkedIn,” says LinkedIn’s Angela Yang. “With nearly 22 million members in Brazil, the potential to reach a new audience, be discovered by like-minded professionals and expand the professional reach is tremendous. From building relationships and establishing themselves as experts, to landing new opportunities and growing their businesses — the benefits that LinkedIn members are experiencing make us even more excited to bring these tools to all of our members, around the globe.”

    “As professionals, we all have our own perspective on the world around us, but until recently, we didn’t always have the right platform to share it on,” she says. “That’s why it came as no surprise that when we made it possible for all English speaking members to publish long-form posts on LinkedIn, it quickly became one of the fastest growing features on the site. Today, LinkedIn has become known as the definitive professional publishing platform around the world.”

    Last month, LinkedIn announced that over a million people had published a post using the platform. They first opened it up to everyone in February of last year. The company says over a million unique publishers publish over 130,000 posts a week, and about 45% of readers are in the upper ranks of their industries, such as managers, VPs, and CEOs. The average post now reaches professionals in 21 industries and 9 countries, it says.

    In June, LinkedIn launched a new version of its Pulse news reader app, which makes use of the user’s LinkedIn network when determining what content to show them.

    Meanwhile, marketers are increasing their focus on LinkedIn. A recent study from Social Media Examiner asked marketers to select one social platform as the most important. 21% selected LinkedIn, second only to Facebook. For B2B businesses, LinkedIn beats out Facebook based on other studies.

    Image via LinkedIn

  • Selling To Customers Through ‘Shoppable Videos’

    Selling To Customers Through ‘Shoppable Videos’

    Everyone knows online video can be a great way to market businesses and products, but some businesses are finding that it can be quite beneficial for actually selling products. “Shoppable video” is a trend that has been slowly rising for several years, but new capabilities from a variety of platforms indicate that it could be poised to become much bigger.

    Is video already a part of your marketing strategy? Is it part of your selling strategy? Tell us about your efforts in the comments.

    “Retail video brings merchants’ products to life in a way that only e-commerce video can, often resulting in higher customer satisfaction and higher retail sales conversion,” says video marketing news blog ReelSEO.

    YouTube for Shopping

    Greg Jarboe writes on the site that YouTube Shopping is the new window shopping and that “unlike the mall, YouTube never, ever sleeps.” He cites data directly from Google claiming that one third of all shopping searches happen between the hours of 10PM and 4AM.

    A couple months ago, Google announced that it is extending its product listing ads (PLAs) to YouTube with TrueView for Shopping, its new format that lets businesses run product ads with related videos.

    “Whether it’s watching a product review or learning how to bake a soufflé, we look to video in countless moments throughout to the day to help us get things done,” Google said in a blog post. “We call these micro-moments – when we reflexively turn to our devices to learn more, make a decision, or purchase a product.”

    It said it launched TrueView for shopping to “connect the dots between the moment a person watches a video and the moment they decide to make a purchase,” while also making it easy for viewers to get more info on the business’ products with the option to click to buy.

    With these ads, businesses can showcase product details and images, and users can click and purchase from a brand or retail site from within the video ad. The option is available for TrueView in-stream video ads, and works across mobile, desktop, and tablet. 50% of views on YouTube come from mobile.

    The ads are integrated with Google Merchant Center, so you can connect campaigns with a Merchant Center feed to dynamically add products and customize ads through contextual and audience signals such as geography and demographic information.

    “Brands that have participated in our early tests of TrueView for shopping have seen strong results for driving interest and sales,” Google noted in the announcement. “Online home goods retailer Wayfair, for instance, saw a 3X revenue increase per impression served when compared to previous campaigns. And beauty retailer Sephora took advantage of this new ad format to drive +80% lift in consideration and +54% lift in ad recall, and an average view time of nearly two minutes.”

    If You Teach Them, They Just Might Buy

    In an article last week, the National Retail Federation looked at how Williams-Sonoma, in partnership with Visa Checkout, became one of the first brands to utilize the new TrueView shoppable video ads:

    Shoppers viewing a series of videos created by Tastemade, a global food lifestyle network for digital platforms, can buy the featured items — including glasses, cocktail plates and platters — directly from the video. The campaign “clicks” on multiple fronts — engaging and informative videos showcasing products that can be purchased in just a few clicks point to how marketers are increasingly focusing on visual elements to provide inspiration on mobile.

    “The videos don’t feel promotional. They teach viewers how to prepare a summer meal using Williams-Sonoma products, which can be purchased easily using Visa Checkout,” says Chris Curtin, chief brand and innovation marketing officer at Visa. “Visa Checkout is a simpler payment system. It takes 44 fields of information and compresses it into just a few clicks. The combination of shoppable video and a faster transaction give new meaning to the idea of instant gratification.”

    Google recently gave marketers some best practices for capitalizing on major growth in how-to searches on YouTube. Believe it or not, these types of searches have seen 70% growth year-over-year. A whopping one hundred million hours of such content has already been watched in North America in 2015, it says. According to Google, people look for how-to videos increasingly on mobile with 91% of smartphone users turning to their devices for ideas while completing a task. These searches are on the rise across all age groups, but millennials are especially likely to search YouTube for how-to videos. 67% of them agree that they can find a YouTube video on anything they want to learn.

    “When people ask how to do something, that’s a need,” wrote David Mogensen, Head of B2B Product Marketing for YouTube and Google Display. “That’s someone asking, ‘can you help me out?’ Digital media let brands respond to those questions and be there at the very moment someone needs them most. Brands that successfully do this can win loyalty and drive sales to boot. In fact, nearly one in three millennials say they’ve purchased a product as a result of watching a how-to video.”

    He talked about how Home Depot has a bunch of how tos for home improvement and how Valspar has content about various paint-related subjects. Home improvement, beauty, and cooking are among the most popular categories for how-to searches.

    As far as best practices, Google said to identify the “I-want-to-do moments” in which people have a need that your brand can help with. It says to find these moments across the whole consumer journey and put them at the center of your strategy. You should also figure out what questions and concerns people have related to the types of projects you sell or the projects they’re used for, and then create the content to serve as resources for those, it says.

    Google also suggested looking at when how-to searches occur, and making your videos easier to find by adding descriptive titles, details, and relevant tags to each video. Promoting the videos is another option.

    One thing that Mogensen didn’t really get into that is certainly worth considering is how frequently videos appear in Google search results. You have to imagine that there are plenty of these how-to searches happening right on Google.

    We recently looked at a study on Google Universal Search trends, and video is the most frequent type of universal result Google shows. They appeared in 55% of search results pages analyzed. While the percentage of search results pages showing video results actually fell over the course of 2014, videos appear more often than anything else by far. 80% of videos displayed in Universal Search results came from YouTube.

    Growing Opportunity in Social

    Look for Facebook, Twitter, and Pinterest to play bigger roles for shoppable videos as time goes on.

    Facebook is doing everything in its power to compete with YouTube in video advertising, and it’s even currently testing a feature, which could greatly increase the amount of video people actually consume on Facebook. They’re letting users continue to watch videos via a pop-out box as they continue to browse their News Feeds.

    Once this goes live on a wider scale, people will no longer have to stop what they’re doing on Facebook to consume a video. They can hit the button and play it while they go about their browsing business. It’s not inconceivable for Facebook to show related ads in the News Feed as they continue, though we’ve seen no indication so far that this is the plan.

    In addition to stepping up its video game, however, Facebook is also making moves to become a better place for businesses to sell things. In fact, there are even new reports that it’s working on some kind of virtual assistant to help people buy things.

    There are companies focusing on bringing shoppable videos to Facebook as we speak.

    Much like Facebook, Twitter is also rampantly trying to become a better place for businesses to sell items. It recently showed off some new product pages that show a great deal of potential. It’s also trying to get businesses to use video more.

    Pinterest is now offering “buyable pins,” and let’s not forget that Pinterest isn’t just about static images. It’s also full of video.

    Shoppable video on YouTube is one thing, but we can expect social to become a much bigger part of the picture once these endeavors get into full swing.

    “For shoppable video to be a more effective tool, marketers need to incorporate it into their broader content marketing strategy and use it as an assistant help the customer in their buying journey,” says Vebeka Guess at Econsultancy.

    She suggests using video as an overview guide to products or services, as a catalog, or as a how-to. She goes on to note that marketers can have trouble quantifying their ROI on shoppable video mainly due to a lack of standardization, which makes it difficult to capture data. She says to find a tech partner that will help you own creation, management, and delivery of shoppable video content and allow for “seamless capture and reporting on meaningful metrics”.

    According to her, this is the key to shoppable video becoming more widely adopted.

    Do you see this becoming part of your strategy in the future? Have you already experimented with it? To what end? Discuss in the comments.

    Images via Thinkstock, Google, Facebook, Twitter

  • Infographic Looks At The State Of B2B Product Marketing in 2015

    Infographic Looks At The State Of B2B Product Marketing in 2015

    Kapost, the company behind the marketing content engine of the same name, recently released an ebook called The Blueprint of Modern Product Launch Marketing looking at how to “make a splash” when launching a product.

    In marketing that, the company shared an infographic (via MarketingProfs) looking at The State of B2B Product Marketing in 2015. It makes use of research collected by Regalix, which spoke to senior marketers about trends and practices. At nearly 70%, understanding the buyer was the most cited go-to-market strategy, and creating marketing collateral is a top priority.

    Most B2B companies do invest in product marketing as only 16% do not, according to the findings. Websites and email are the dominant digital channels. take a look at the graphic for a summary of the findings.

    b2bproduct

    Images via Thinkstock, Kapost

  • How Should B2B Companies Approach Pinterest?

    How Should B2B Companies Approach Pinterest?

    Are there benefits to spending time and resources on Pinterest when you’re a B2B company? Sure, people love it for finding recipes, crafts, and other consumer-facing ideas, and there’s plenty of hype about how great of a marketing tool it has become, but does this apply to you?

    Are you a B2B business using Pinterest? Has it been worth your effort? Tell us about your approach.

    A recent study found that most pinners have bought something because of Pinterest. That’s good to know first off. People are taking action and buying. First you have to get in front of people. That means gaining a following by contributing visual content that people find interesting. One of the best ways to get in front of Pinterest users is to appear in their home feed and catch their eye from there.

    Another important path to visibility is through search. We talk about how to optimize for Pinterest search here, and more with noted Pinterest marketing veteran Vincent Ng here.

    Optimizing for Pinterest’s search feature (which is only getting better and better as time goes on) is one thing, but don’t discount the fact that Pinterest content can easily surface in Google results as well. On top of the regular organic search results, both Google and Bing have features that further highlight Pinterest content. As recently as last week, Google added a Pinterest carousel to results.

    According to Pam Neely at Act-on.com, there are at least 17 “smart ways” B2B marketers can use Pinterest. These include: a board for company infographics; boards featuring products/services; a board for blog posts; a board for email newsletters; boards for keywords you want to rank for; boards for employees; boards for case studies; boards for webinars/Slideshares; boards for white papers; boards for videos; boards highlighting customers of the month; boards for inspirational/entertaining quotes; boards for events; boards about life at the company; boards for humorous things; boards for direct mail pieces; and boards for portfolio items.

    Hubspot recommends “mastering” Pinterest for B2B marketing by utilizing visual content you already have, such as as strong visuals from your blog articles, infographics, data charts, ebook/book covers, and photos of your customers, and trying to send traffic with specific links in each pin.

    “In the B2B world, using Pinterest as a tool solely to ‘enhance your brand’ isn’t going to cut it,” writes Hubspot’s Rebecca Corliss in a blog post. “When leads and customers are your bottom line, it’s really important that you’re driving quality traffic to your website with the goal of conversion.”

    She also recommends including landing pages in your pins’ descriptions and adding more calls to action around the visual content on your site.

    “Some B2B brands have complex products and services that take a long time to explain,” suggests Julia Borgini at B2BNN. “Use a board on Pinterest to explain how those complex products and services work.”

    Personally, I’d recommend finding people on Pinterest who are following and engaging with accounts, boards, and pins related to whatever it is that your business offers, and trying to form new connections from there.

    Oh So Pinteresting has an interesting conversation with Organic Salon Systems, a B2B company who has seen success using Pinterest. It shares these five tips from them:

    1. How to videos, subject matter guides and trend-related articles are all great ways to engage audiences and keep them coming back for more.

    2. Create great pinnable content, use calls to action and high value search terms. Make your pins friendly to both Pinterest search and overall SEO.

    3. Outsourcing graphics and using resources such as Pixlr and Canva.

    4. Use an authentic, organic approach to pinning. Pinterest, when used effectively, can eventually go on auto-pilot generating traffic and follows from content new and old.

    5. Check pins from your site using pinterest.com/source/yoururl to see who is pinning your content, how they are interacting, engage with your readers and seek out trends.

    Pinterest has been growing in importance in the ecommerce world, and while that may be mainly at the B2C level, there’s no reason to think that there isn’t great potential for B2B commerce as well, particularly as Pinterest’s user base itself grows as does the number of eligible merchants for the new Buyable Pins.

    Here’s a look at what businesses should know about Buyable Pins for now.

    Businesses will also likely find value in the relatively new Marketing Developer Partners program, which will enable them to make better use of data with the help of third-party services.

    Is it worth it to dedicate time and resources to Pinterest as a B2B company in your opinion? Tell us what you think.

    Related Reading: Does Instagram Have Any Value to B2B Marketers?

  • Marketers Are Increasing Their Focus On LinkedIn

    Marketers Are Increasing Their Focus On LinkedIn

    Marketers are starting to take LinkedIn much more seriously – especially B2B marketers. Research shows that more marketers are planning on increasing their use of the professional social network.

    A recent Social Media Examiner study looked at how marketers are using social media to grow their businesses. It didn’t focus exclusively on LinkedIn, but there are a lot signs within it that point to a bigger focus on the network as time goes on (h/t: B2BNN).

    When allowed to select just one social platform as the most important, 52% of marketers picked Facebook, but 21% picked LinkedIn. It takes the number three spot in terms of those actually being used:

    Screen shot 2015-06-29 at 11.22.02 AM

    It’s also in third place behind Facebook and Twitter in platforms used by those with less than twelve months experience. As you’d expect, LinkedIn gets more importance placed on it by B2B marketers. Those focused on B2C are placing more emphasis on Facebook, YouTube, Pinterest, and Instagram, while B2B marketers are focused on LinkedIn, Twitter, Google+, and SlideShare (which LinkedIn acquired).

    For B2B, LinkedIn completely dominates the pack:

    Screen shot 2015-06-29 at 11.31.04 AM

    In terms of overall importance to marketers, LinkedIn increased to 21% from 17% since 2014 as Facebook decreased slightly. For the self-employed, LinkedIn scored 23% just behind first-place Facebook (44%).

    The study also found that 66% of marketers plan to increase their use of LinkedIn in the future. As you’d guess, B2B marketers are more likely to plan on increasing their use. 80% of B2B marketers plan on doing so versus 56% of B2C marketers. 71% of B2B marketers are interested in learning more about LinkedIn as are 55% of B2C marketers. It’s the number two network behind Facebook when it comes to what marketers want to educate themselves about.

    18% of marketers are regularly using LinkedIn ads, the study found. That’s actually down from 20%. Still, 29% plan to increase their us of LinkedIn ads.

    LinkedIn recently extended its ads to publishers sites via LinkedIn Network Display. According to the company, these ads enable marketers to reach a “high-value audience of business professionals” both on and off LinkedIn, while targeting the right people to increase brand awareness with those “who matter most”. You can also track the impact of the ads with its campaign and website analytics.

    Looking at content types, the study found that 69% of marketers plan on increasing their use of blogs. It will be interesting to see if LinkedIn’s publishing platform, which it opened up to all users last year, will show that kind of growth.

    LinkedIn’s Pulse news reader also got a big revamp in recent weeks, which places emphasis on users’ LinkedIn networks. Look for content marketing opportunities to arise from this as well.

    Images via Thinkstock, Social Media Examiner report

  • Twitter Just Made Periscope Better For Marketing

    Twitter Just Made Periscope Better For Marketing

    Twitter just added functionality to its Periscope livestreaming service that could make it more effective for business and marketing scenarios. Now, users don’t have to be on their mobile devices to watch streams that have concluded.

    Before, you had to be using the iOS or Android app to view a livestream, but now if you click on a link from Twitter on your desktop, for example, you should be able to easily view the video with no problem.

    Like before, the videos only stay up for 24 hours, but by making them viewable on the web, they’re being opened up to a much bigger potential audience. This could prove even more beneficial if and when Google expands its real time tweet feature, which it recently enabled on mobile, to the desktop.

    Periscope recently became available to a lot more people when Twitter launched the Android app, so the chances for more people to watch these videos are rapidly growing.

    Earlier this week, we looked at some advice Twitter is giving businesses and marketers for using Periscope to promote their brands, events, and offers.

    “Brands can forge a more personal relationship with consumers by using Periscope to give them real-time access to moments that matter, from big announcements to fashion shows to sponsored events,” says Ross Hoffman, Twitter’s Head of Brand Strategy.

    Though much of our internet use is increasingly taking place on mobile, there is still a great deal of importance left when it comes to the desktop, so this is a significant move for Twitter’s new service. Instagram recognizes this as well, and recently made improvements to its web interface. For B2B businesses, the web means reaching people who sit at their desks all week, so that’s something to consider now with your Periscope efforts.

  • Infographic Takes A Crack At The ‘Science’ Of Instagram Marketing

    Infographic Takes A Crack At The ‘Science’ Of Instagram Marketing

    While the brands that are using Instagram as part of their marketing strategies are seeing a great deal of benefit from doing so, a shockingly low number of brands are actually making use of it. Based on various studies, however, that will change as more wise up to what Facebook’s visual social network has to offer.

    Why aren’t more brands taking advantage of Instagram?

    “Instagram is still a fairly new platform, and is late in the advertising game – the platform introduced sponsored posts just two years ago. It’s possible that before 2013, marketers didn’t view Instagram as a must-have, but rather as a nice to have. As engagement and users increase, I have no doubt that we’ll see more brands adopt the platform,” Bob Sybydlo, Director, Market Intelligence and Deliverability Yesmail recently told WebProNews after releasing a study on the subject.

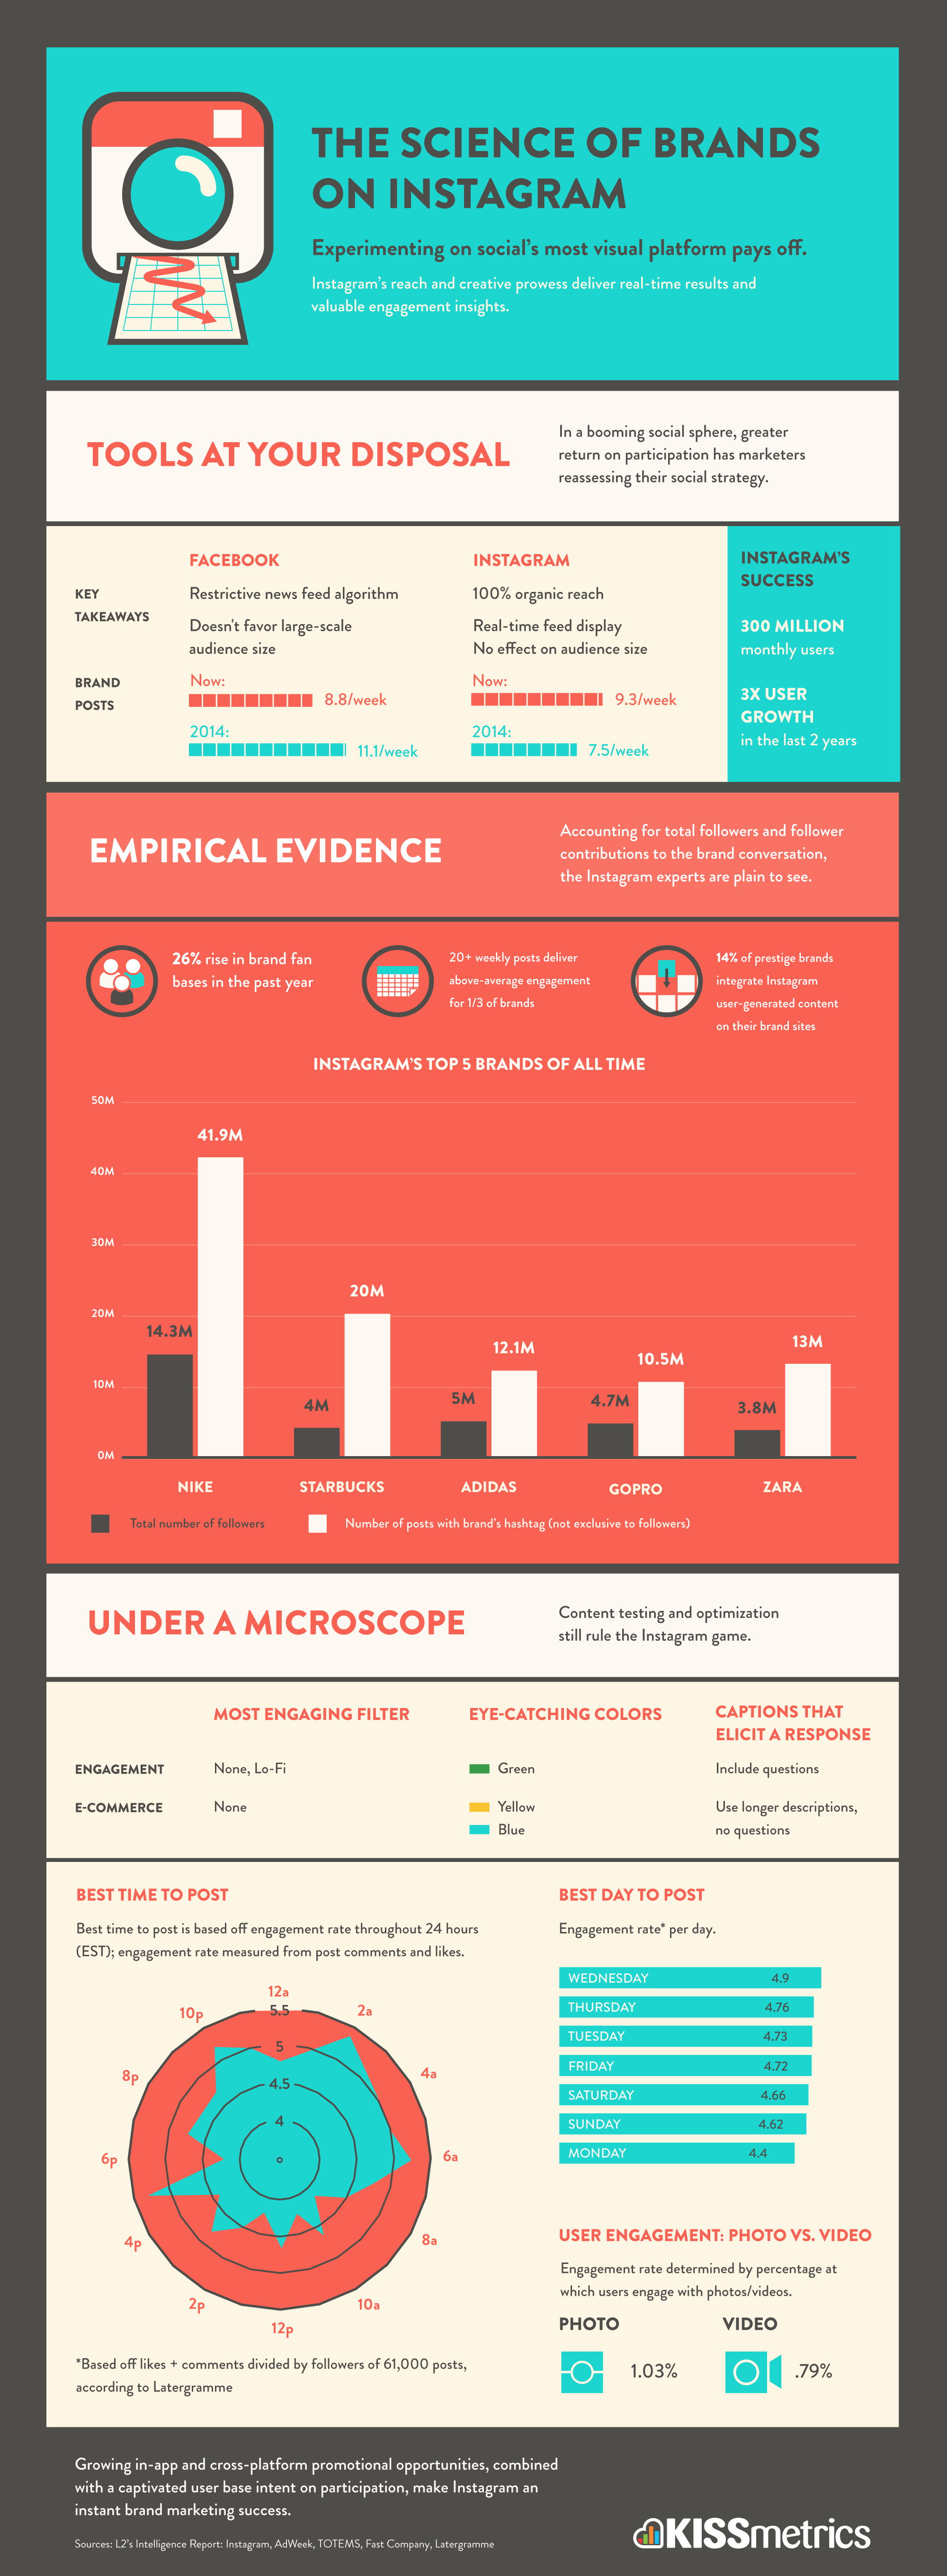
    Kissmetrics has a new infographic out looking at the “science of brands” on the platform, finding that experimenting pays off.

    “Content testing and optimization still rule the Instagram game,” it says.

    ++ Click Image to Enlarge ++

    Source: The Science of Brands on Instagram (Infographic)

    These are consumer brands though. Is there any value to the platform for B2B businesses?

    Last week, we looked at some findings from Social Media Examiner, which showed that B2B marketers have placed pretty much zero significance on Instagram. That does appear to be changing as well, however. The report also found that 40% of B2B marketers intend to increase their Instagram activity. That number is likely to continue to grow as well.

    Via B2Bnn.com

  • Does Instagram Have Any Value To B2B Marketers?

    Does Instagram Have Any Value To B2B Marketers?

    Instagram has obviously become a major channel of focus for some marketers, but it would seem that only B2C marketers place much significance on it.

    Do you see Instagram as a valuable tool for B2B marketing? Share your thoughts in the comments.

    A recent report from Social Media Examiner finds that while it’s about on par with YouTube, Google+, and Pinterest for B2C marketers in terms of importance of social platforms, it doesn’t even register with B2B marketers.

    You would think from this information that B2B marketers see little value in Instagram as a marketing vehicle. It certainly seems to appeal much more to the B2C space. There’s another stat in the report, however, that suggests otherwise. While B2C interest still dominates, 40% of B2B marketers intend to increase their Instagram activity.

    Beverley Reinemann at Distilled lists some ways that B2B businesses should think about using Instagram, including telling your brand’s story, establishing long-term connections, demonstrating skills, humanizing your brand, and creating a community.

    “The key to leveraging Instagram as a marketing tool for B2B brands is to not think of it as a marketing tool at all. Instead, you want to think about Instagram as a way of telling your story as part of a larger online marketing strategy,” she writes. “Fedex do this very well. Their Instagram feed is full of beautifully composed photos, many of which feature their easily-recognisable Fedex trucks and planes. In fact, you can’t scroll through the Fedex Instagram feed without feeling as though, while you’re idly scrolling, they’re hard at work. The impression, here, is that Fedex trucks are always moving, always delivering, always there. And, for businesses who rely on deliveries being on time, that’s a really important message to be able to take away.”

    Mention.com content and PR manager Brittany Berger recommends using Instagram to show your company’s history, provide demos and tutorials, nurture thought leadership, share company news, promote content from other channels, enhance event marketing, highlight employees, run contests, and give company culture insight.

    If you want to go the contest route, Social Media Today happens to have a new article out highlighting some different approaches and brands that gotten it right. Approaches include “like to win” contests, hashtag user-generated content contests, and email-gated contests. The brands that got it right, according to that article, are: Dunkin Donuts, Tony Hawk, and Absolut.

    Totems has a nice ranking of the most popular B2B companies on Instagram. I’d sugggest perusing the accounts of some of those to get some ideas on how to approach your strategy.

    You might also want to give this brief podcast from Link Humans on B2B Instagram use a listen:

    And here’s a presentation on the subject from Uberflip. Keep in mind it’s from last year, so some stats are a little dated.

    A while back, we talked to Gary Jordan of TheInstagramExpert.com, and he shared his thoughts on how businesses should approach getting started with the platform.

    “You have to foster a conversation between your brand/business and your followers/customers,” he said. “The closer they feel to the business, the more likely they are to become a superfan. This can be done relatively easy on Instagram by just liking & commenting on the content of other users, and re-posting some of your favorite photos of theirs on your timeline and shouting them out.”

    “Another good way to keep your followers engaged is to have them submit their best photos to you, that are related to your business or what it offers, for a chance for them to be featured on your page,” he added. “The best way to keep all submissions in order is by utilizing a specific hashtag that your followers can use to submit.”

    There are plenty of other words of advice on the subject in our discussion here.

    Do you see significant marketing opportunities in the B2B space with Instagram? Let us know what you think.

    Related Reading:

    Instagram Ads Getting More E-Commerce Friendly?

    How Brands Are Generating Engagement On Instagram

    Report Finds Shockingly Low Percentage Of Brands On Instagram

    Why Aren’t More Brands Taking Advantage Of Instagram?

    Facebook’s Organic Reach Murder Is Sending Brands to Instagram in Droves – But Are They Following a Sirens’ Song?

    Graph via Social Media Examiner

  • Google Says To Reach YouTube Users On How-To Searches

    Google Says To Reach YouTube Users On How-To Searches

    Google is giving marketers some best practices for capitalizing on major growth in how-to searches on YouTube. Believe it or not, these types of searches have seen 70% growth year-over-year. A whopping one hundred million hours of such content has already been watched in North America in 2015, it says.

    In other words, this is an opportunity for businesses who can provide high quality how-to content to attract some eyeballs.

    This information comes from a Think with Google article by David Mogensen, Head of B2B Product Marketing for YouTube and Google Display (via Marketing Land). According to him, people look for how-to videos increasingly on mobile with 91% of smartphone users turning to their devices for ideas while completing a task.

    These searches are on the rise across all age groups, but millennials are especially likely to search YouTube for how-to videos. According to Google, 67% of them agree that they can find a YouTube video on anything they want to learn.

    I guess that’s why Google Helpouts didn’t take off.

    “Being there in these moments may be the single most important thing a marketer can do, but many aren’t,” writes Mogensen. “Marketing is still largely planned against brand moments and milestones, and it is anchored to campaign flights and product launches—not personal moments like these. The reason for this is simple. Most marketing plans are grounded in traditional one-way media: Broadcast from brands to large audiences.” Without signals of intent, traditional media makes it impossible to know whether someone actually needs or wants your product.

    “But when people ask how to do something, that’s a need,” he continues. “That’s someone asking, ‘can you help me out?’ Digital media let brands respond to those questions and be there at the very moment someone needs them most. Brands that successfully do this can win loyalty and drive sales to boot. In fact, nearly one in three millennials say they’ve purchased a product as a result of watching a how-to video.”

    He talks about how Home Depot has a bunch of how tos for home improvement and how Valspar has content about various paint-related subjects.

    Home improvement, beauty, and cooking are among the most popular categories for how-to searches.

    As far as best practices, Google says to identify the “I-wan-to-do moments” in which people have a need that your brand can help with. It says to find these moments across the whole consumer journey and put them at the center of your strategy. You should also figure out what questions and concerns people have related to the types of projects you sell or the projects they’re used for, and then create the content to serve as resources for those, it says.

    Google also suggests looking at when how-to searches occur, and making your videos easier to find by adding descriptive titles, details, and relevant tags to each video. Promoting the videos is another option.

    One thing that Mogensen didn’t really get into that is certainly worth considering is how frequently videos appear in Google search results. You have to imagine that there are plenty of these how-to searches happening right on Google.

    We recently looked at a study on Google Universal Search trends, and video is the most frequent type of universal result Google shows. They appeared in 55% of search results pages analyzed. While the percentage of search results pages showing video results actually fell over the course of 2014, videos appear more often than anything else by far. 80% of videos displayed in Universal Search results came from YouTube.

    Image via Google

  • LinkedIn Extends Ads To Publisher Sites

    LinkedIn Extends Ads To Publisher Sites

    There’s something of a trend happening with social media advertising platforms expanding to reach customers on third-party websites away from the actual social networks themselves. LinkedIn is now joining in.

    The company announced the launch of the LinkedIn Lead Accelerator as well as the LinkedIn Network Display, which extends its platform to “thousands” of publisher sites.

    “Today LinkedIn marks a significant step in its goal to be the most effective platform for B2B marketers,” a spokesperson for the company tells WebProNews. “The company is unveiling an expanded Marketing Solutions portfolio that enables these marketers to reach, nurture and acquire professional customers — on and off the LinkedIn platform.

    “The core new product fueling this full-funnel approach is called LinkedIn Lead Accelerator, which connects companies to the right professionals with the right content throughout the complex purchase decision process,” they explain. “This addition reflects the integration and enhancement of Bizo’s Multi-Channel Nurturing product, which came as part of LinkedIn’s acquisition of the company in August 2014.”

    According to the company, 95% of website visitors never provide an email address to marketers, and of the 5% who do, only about 20% open the prospecting emails they get afterwards. Overall, it says, most marketers are converting less than 1% of possible leads.

    This is where the new Marketing Solutions Platform comes in.

    “Prior to today, products like Sponsored Updates or LinkedIn Display Advertising were used to achieve individual marketing objectives,” says LinkedIn’s Russell Glass in a blog post. “Now, with the full-funnel approach, marketers can use all of our marketing solutions products together as a portfolio to create a customized experience that enhances the marketer-prospect relationship and delivers results.”

    Marketers can get started with the new tools here.

    Image via LinkedIn

  • LinkedIn Earnings Released, Revenue Up 45%

    LinkedIn Earnings Released, Revenue Up 45%

    LinkedIn just released its earnings report for the third quarter, posting revenue of $568 million, up 45% year-over-year. Revenue from the U.S. totaled $343 million, and represented 60% of total revenue

    Net loss was $4.3 million, compared to $3.4 million for the third quarter of 2013.

    The company beat analysts’ expectations on EPS of $0.52.

    CEO Jeff Weiner said, “LinkedIn made significant progress against several long-term strategic investments we began this year. During the third quarter, we took meaningful steps in increasing the scale and relevance of job listings, growing the professional publishing platform, and expanding our member network in new geographies and demographics.”

    Here’s the release in its entirety:

    MOUNTAIN VIEW, Calif., Oct. 30, 2014 (GLOBE NEWSWIRE) — LinkedIn Corporation (NYSE:LNKD), the world’s largest professional network on the Internet, with more than 300 million members, reported its quarterly results for the third quarter of 2014:

    • Revenue for the third quarter was $568 million, an increase of 45% compared to $393 million in the third quarter of 2013.
    • Net loss attributable to common stockholders for the third quarter was $(4.3) million, compared to net loss of $(3.4) million for the third quarter of 2013. Non-GAAP net income for the third quarter was $66 million, compared to $47 million for the third quarter of 2013. Non-GAAP measures exclude tax-affected stock-based compensation expense and tax-affected amortization of acquired intangible assets.
    • Adjusted EBITDA for the third quarter was $151 million, or 27% of revenue, compared to $93 million for the third quarter of 2013, or 24% of revenue.
    • GAAP diluted EPS for the third quarter was $(0.03), compared to GAAP diluted EPS of $(0.03) for the third quarter 2013; non-GAAP diluted EPS for the third quarter was $0.52, compared to non-GAAP diluted EPS of $0.39 for the third quarter of 2013.

    “LinkedIn made significant progress against several long-term strategic investments we began this year,” said Jeff Weiner, CEO of LinkedIn. “During the third quarter, we took meaningful steps in increasing the scale and relevance of job listings, growing the professional publishing platform, and expanding our member network in new geographies and demographics.”

    Third Quarter Operating Summary

    • Talent Solutions: Revenue from Talent Solutions products totaled $345 million, an increase of 45% compared to the third quarter of 2013. Talent Solutions revenue represented 61% of total revenue in the third quarter of 2014, compared to 60% of total revenue in the third quarter of 2013.
    • Marketing Solutions: Revenue from Marketing Solutions products totaled $109 million, an increase of 45% compared to the third quarter of 2013. Marketing Solutions revenue represented 19% of total revenue in the third quarter of 2014 and 2013.
    • Premium Subscriptions: Revenue from Premium Subscriptions products totaled $114 million, an increase of 43% compared to the third quarter of 2013. Premium Subscriptions represented 20% of total revenue in the third quarter of 2014 and 2013.

    Revenue from the U.S. totaled $343 million, and represented 60% of total revenue in the third quarter of 2014. Revenue from international markets totaled $225 million, and represented 40% of total revenue in the third quarter of 2014.

    Revenue from the field sales channel totaled $342 million, and represented 60% of total revenue in the third quarter of 2014. Revenue from the online, direct sales channel totaled $227 million, and represented 40% of total revenue in the third quarter of 2014.

    Third Quarter Highlights and Strategic Announcements

    In the third quarter of 2014:

    • LinkedIn increased the scale and relevance of job listings by expanding “Limited Listings” offerings to a broad base of US and global companies. Jobs seekers now have access to nearly two million job listings on LinkedIn, driving strong momentum for the Job Search mobile app.
    • LinkedIn officially launched the all new Sales Navigator to empower sales professionals to establish and grow relationships with prospects and customers. This new stand-alone product experience allows sales professionals to stay updated about key accounts, focus on the right people, and build trusted relationships.
    • LinkedIn announced the acquisition of Bizo, accelerating the ability to develop an end-to-end B2B marketing platform. Building on the success of Sponsored Updates, Bizo’s team and technology will expand LinkedIn’s ability to leverage current content marketing products and offer a wider range of solutions to meet our customers’ marketing objectives.

    “LinkedIn demonstrated strength in the third quarter, leveraging the scale created by our member network to deliver growth across all three product lines,” said Steve Sordello, CFO of LinkedIn. “We continue to make aggressive investments in our member and customer platforms in order to realize our long-term potential.”

    Business Outlook

    LinkedIn is providing guidance for the fourth quarter and full year of 2014:

    • Q4 2014 Guidance: Revenue is expected to range between $600 million and $605 million. Adjusted EBITDA is expected to range between $153 million and $155 million. Non-GAAP EPS is expected to be approximately $0.49. The company expects depreciation of approximately $59 million, amortization of approximately $12 million, stock-based compensation of approximately $96 million, and 127 million fully-diluted weighted shares.
    • Full Year 2014 Guidance: Revenue is expected to range between $2.175 billion and $2.180 billion. Adjusted EBITDA is expected to range between $566 and $568 million. Non-GAAP EPS is expected to be approximately $1.89. The company expects depreciation of approximately $203 million, amortization of approximately $34 million, stock-based compensation of approximately $321 million, and 126 million fully-diluted weighted shares.

    Quarterly Results Webcast and Conference Call

    LinkedIn will host a webcast and conference call to discuss its third quarter 2014 financial results and business outlook today at 2:00 p.m. Pacific Time. Jeff Weiner and Steve Sordello will host the webcast, which can be viewed on the investor relations section of the LinkedIn website at http://investors.linkedin.com/. This call will contain forward-looking statements and other material information regarding the company’s financial and operating results. Following completion of the call, a recorded replay of the webcast will be available on the website.

    Upcoming Events

    Management will participate in upcoming financial Q&A discussions at industry events on November 18th and December 2nd, 2014. LinkedIn will furnish a link to these events on its investor relations website, http://investors.linkedin.com/ for both the live and archived webcasts.

    About LinkedIn

    LinkedIn connects the world’s professionals to make them more productive and successful and transforms the ways companies hire, market and sell. Our vision is to create economic opportunity for every member of the global workforce through the ongoing development of the world’s first Economic Graph. LinkedIn has more than 300 million members and has offices around the world.

    Non-GAAP Financial Measures

    To supplement its condensed consolidated financial statements, which are prepared and presented in accordance with GAAP, the company uses the following non-GAAP financial measures: adjusted EBITDA, non-GAAP net income, and non-GAAP diluted EPS (collectively the “non-GAAP financial measures”). The presentation of this financial information is not intended to be considered in isolation or as a substitute for, or superior to, the financial information prepared and presented in accordance with GAAP. The company uses these non-GAAP financial measures for financial and operational decision making and as a means to evaluate period-to-period comparisons. The company believes that they provide useful information about operating results, enhance the overall understanding of past financial performance and future prospects, and allow for greater transparency with respect to key metrics used by management in its financial and operational decision making.

    The company excludes the following items from one or more of its non-GAAP measures:

    Stock-based compensation. The company excludes stock-based compensation because it is non-cash in nature and because the company believes that the non-GAAP financial measures excluding this item provide meaningful supplemental information regarding operational performance and liquidity. The company further believes this measure is useful to investors in that it allows for greater transparency to certain line items in its financial statements and facilitates comparisons to peer operating results.

    Amortization of acquired intangible assets. The company excludes amortization of acquired intangible assets because it is non-cash in nature and because the company believes that the non-GAAP financial measures excluding this item provide meaningful supplemental information regarding operational performance and liquidity. In addition, excluding this item from the non-GAAP measures facilitates comparisons to historical operating results and comparisons to peer operating results.

    Accretion of redeemable noncontrolling interest. The accretion of redeemable noncontrolling interest represents the accretion of the company’s redeemable noncontrolling interest to its redemption value. The company excludes the accretion because it is non-cash in nature and because the company believes that the non-GAAP financial measures excluding this item provide meaningful supplemental information regarding operating performance. In addition, excluding this item from the non-GAAP financial measures facilitates comparisons to historical operating results and comparisons to peer operating results.

    Income tax effects and adjustments. The company adjusts non-GAAP net income by considering the income tax effects of excluding stock-based compensation and the amortization of acquired intangible assets. Beginning in the first quarter of 2014, the company has implemented a non-GAAP tax rate for evaluating its operating performance as well as for planning and forecasting purposes. This projected non-GAAP tax rate eliminates the effects of non-recurring and period specific items, which can vary in size and frequency and does not necessarily reflect our long-term operations. Historically, the company computed a non-GAAP tax rate based on non-GAAP pre-tax income on a quarterly basis. Based on our current forecast, a non-GAAP tax rate of 35% has been applied to our non-GAAP financial results for the current period. The company believes that adjusting for these income tax effects and adjustments provides additional transparency to the overall or “after tax” effects of excluding these items from non-GAAP net income.

    Dilutive shares under the treasury stock method. During periods with a net loss, the company excluded certain potential common shares from its GAAP diluted shares because their effect would have been anti-dilutive. On a non-GAAP basis, these shares would have been dilutive. As a result, the company has included the impact of these shares in the calculation of its non-GAAP diluted net income per share under the treasury stock method.

    For more information on the non-GAAP financial measures, please see the “Reconciliation of GAAP to Non-GAAP Financial Measures” table in this press release. This accompanying table has more details on the GAAP financial measures that are most directly comparable to non-GAAP financial measures and the related reconciliations between these financial measures. Additionally, the company has not reconciled adjusted EBITDA or non-GAAP EPS guidance to net income (loss) or GAAP EPS guidance because it does not provide guidance for either other income (expense), net, or GAAP provision for income taxes, which are reconciling items between net income (loss) and adjusted EBITDA and non-GAAP EPS. As items that impact net income (loss) are out of the company’s control and/or cannot be reasonably predicted, the company is unable to provide such guidance. Accordingly, a reconciliation to net income (loss) is not available without unreasonable effort.

    Safe Harbor Statement

    “Safe Harbor” statement under the Private Securities Litigation Reform Act of 1995: This press release and the accompanying conference call contain forward-looking statements about our products, including our investments in products, technology and other key strategic areas, certain non-financial metrics, such as customer and member growth and engagement, and our expected financial metrics such as revenue, adjusted EBITDA, non-GAAP EPS, depreciation and amortization, stock-based compensation and fully-diluted weighted shares for the fourth quarter of 2014 and the full fiscal year 2014. The achievement of the matters covered by such forward-looking statements involves risks, uncertainties and assumptions. If any of these risks or uncertainties materialize or if any of the assumptions prove incorrect, the company’s results could differ materially from the results expressed or implied by the forward-looking statements the company makes.

    The risks and uncertainties referred to above include – but are not limited to – risks associated with: our limited operating history in a new and unproven market; engagement of our members; the price volatility of our Class A common stock; general economic conditions; expectations regarding the return on our strategic investments; execution of our plans and strategies, including with respect to mobile products and features; security measures and the risk that they may not be sufficient to secure our member data adequately or that we are subject to attacks that degrade or deny the ability of members to access our solutions; expectations regarding our ability to timely and effectively scale and adapt existing technology and network infrastructure to ensure that our solutions are accessible at all times with short or no perceptible load times; our ability to maintain our rate of revenue growth and manage our expenses and investment plans; our ability to accurately track our key metrics internally; members and customers curtailing or ceasing to use our solutions; our core value of putting members first, which may conflict with the short-term interests of the business; privacy and changes in regulations, which could impact our ability to serve our members or curtail our monetization efforts; litigation and regulatory issues; increasing competition; our ability to manage our growth; our international operations; our ability to recruit and retain our employees; the application of U.S. and international tax laws on our tax structure and any changes to such tax laws; acquisitions we have made or may make in the future; and the dual class structure of our common stock.

    Further information on these and other factors that could affect the company’s financial results is included in filings it makes with the Securities and Exchange Commission from time to time, including the section entitled “Risk Factors” in the company’s Annual Report on Form 10-K for the year ended December 31, 2013, and additional information will also be set forth in our Form 10-Q that will be filed for the quarter ended September 30, 2014, which should be read in conjunction with these financial results. These documents are or will be available on the SEC Filings section of the Investor Relations page of the company’s website athttp://investors.linkedin.com/. All information provided in this release and in the attachments is as of October 30, 2014, and LinkedIn undertakes no duty to update this information.

    LINKEDIN CORPORATION
    TRENDED CONDENSED CONSOLIDATED BALANCE SHEETS
    (In thousands)
    (Unaudited)
    As of
    September 30,
    2013
    December 31,
    2013
    March 31,
    2014
    June 30,
    2014
    September 30,
    2014
    ASSETS
    CURRENT ASSETS:
    Cash and cash equivalents  $ 1,396,292  $ 803,089  $ 508,850  $ 645,092  $ 526,837
    Marketable securities 875,993 1,526,212 1,797,373 1,721,847 1,736,958
    Accounts receivable 208,956 302,168 328,661 347,152 344,773
    Deferred commissions 28,507 47,496 46,575 45,941 40,810
    Prepaid expenses 33,831 32,114 47,513 49,503 55,571
    Other current assets 28,259 44,391 50,933 61,042 79,795
    Total current assets 2,571,838 2,755,470 2,779,905 2,870,577 2,784,744
    Property and equipment, net 336,656 361,741 406,543 476,058 557,017
    Goodwill 150,831 150,871 228,893 228,943 356,369
    Intangible assets, net 43,209 43,046 101,597 99,175 140,802
    Other assets 41,744 41,665 44,931 46,133 67,080
    TOTAL ASSETS  $ 3,144,278  $ 3,352,793  $ 3,561,869  $ 3,720,886  $ 3,906,012
    LIABILITIES, REDEEMABLE NONCONTROLLING INTEREST AND STOCKHOLDERS’ EQUITY
    CURRENT LIABILITIES:
    Accounts payable  $ 70,340  $ 66,744  $ 79,711  $ 90,728  $ 106,658
    Accrued liabilities 139,898 183,004 142,141 164,051 188,983
    Deferred revenue 335,700 392,243 479,576 481,450 463,576
    Total current liabilities 545,938 641,991 701,428 736,229 759,217
    DEFERRED TAX LIABILITIES 15,861 14,879 23,900 24,088 41,327
    OTHER LONG TERM LIABILITIES 51,347 61,529 70,226 80,298 105,043
    Total liabilities 613,146 718,399 795,554 840,615 905,587
    COMMITMENTS AND CONTINGENCIES
    REDEEMABLE NONCONTROLLING INTEREST 5,000 5,126 5,226 5,327
    STOCKHOLDERS’ EQUITY:
    Class A and Class B common stock 12 12 12 12 12
    Additional paid-in capital 2,478,813 2,573,449 2,718,321 2,833,030 2,957,524
    Accumulated other comprehensive income (loss) 470 314 682 863 685
    Accumulated earnings 51,837 55,619 42,174 41,140 36,877
    Total stockholders’ equity 2,531,132 2,629,394 2,761,189 2,875,045 2,995,098
    TOTAL LIABILITIES, REDEEMABLE NONCONTROLLING INTEREST AND STOCKHOLDERS’ EQUITY  $ 3,144,278  $ 3,352,793  $ 3,561,869  $ 3,720,886  $ 3,906,012
    LINKEDIN CORPORATION
    TRENDED CONDENSED CONSOLIDATED STATEMENTS OF OPERATIONS
    (In thousands, except per share data)
    (Unaudited)
    Three Months Ended
    September 30,
    2013
    December 31,
    2013
    March 31,
    2014
    June 30,
    2014
    September 30,
    2014
    Net revenue  $ 392,960  $ 447,219  $ 473,193  $ 533,877  $ 568,265
    Costs and expenses:
    Cost of revenue (exclusive of depreciation and amortization shown separately below) 53,395 57,865 62,455 69,536 74,904
    Sales and marketing 133,172 157,235 166,522 184,494 199,168
    Product development 106,223 113,140 120,622 128,731 136,542
    General and administrative 61,767 64,790 74,618 80,688 89,266
    Depreciation and amortization 33,767 42,750 49,740 56,306 59,782
    Total costs and expenses 388,324 435,780 473,957 519,755 559,662
    Income (loss) from operations 4,636 11,439 (764) 14,122 8,603
    Other income, net 156 1,820 1,026 1,197 152
    Income before income taxes 4,792 13,259 262 15,319 8,755
    Provision for income taxes 8,155 9,477 13,581 16,253 12,917
    Net income (loss) (3,363) 3,782 (13,319) (934) (4,162)
    Accretion of redeemable noncontrolling interest (126) (100) (101)
    Net income (loss) attributable to common stockholders (3,363) 3,782 (13,445) (1,034) (4,263)
    Weighted-average shares used to compute net income (loss) per share attributable to common stockholders:
    Basic  $ (0.03)  $ 0.03  $ (0.11)  $ (0.01)  $ (0.03)
    Diluted  $ (0.03)  $ 0.03  $ (0.11)  $ (0.01)  $ (0.03)
    Net income (loss) per share attributable to common stockholders:
    Basic 113,940 119,849 120,967 122,170 123,427
    Diluted 113,940 124,438 120,967 122,170 123,427
    LINKEDIN CORPORATION
    TRENDED CONDENSED CONSOLIDATED STATEMENTS OF CASH FLOWS
    (In thousands)
    (Unaudited)
    Three Months Ended
    September 30,
    2013
    December 31,
    2013
    March 31,
    2014
    June 30,
    2014
    September 30,
    2014
    OPERATING ACTIVITIES:
    Net income (loss)  $ (3,363)  $ 3,782  $ (13,319)  $ (934)  $ (4,162)
    Adjustments to reconcile net income (loss) to net cash provided by operating activities:
    Depreciation and amortization 33,767 42,750 49,740 56,306 59,782
    Provision for doubtful accounts and sales returns 568 1,254 1,207 4,118 3,805
    Stock-based compensation 54,445 57,177 67,769 74,828 82,910
    Excess income tax benefit from stock-based compensation (10,188) (16,008) (15,982) (18,639) (13,114)
    Changes in operating assets and liabilities:
    Accounts receivable (7,719) (94,627) (26,764) (23,462) 15,657
    Deferred commissions 1,236 (20,028) 1,116 712 4,836
    Prepaid expenses and other assets 3,707 2,926 (11,742) (4,455) (12,148)
    Accounts payable and other liabilities 49,591 44,307 (18,428) 24,726 54,017
    Income taxes, net (531) 4,377 7,928 13,362 8,248
    Deferred revenue 4,513 56,543 87,333 1,874 (18,605)
    Net cash provided by operating activities 126,026 82,453 128,858 128,436 181,226
    INVESTING ACTIVITIES:
    Purchases of property and equipment (83,158) (57,394) (88,871) (96,430) (120,721)
    Purchases of investments (385,517) (851,312) (737,739) (649,803) (501,074)
    Sales of investments 34,937 68,547 72,239 117,359 53,511
    Maturities of investments 83,652 129,646 393,044 604,231 429,641
    Payments for intangible assets and acquisitions, net of cash acquired (8,756) (3,894) (85,061) (4,800) (160,894)
    Changes in deposits and restricted cash (1,355) (6) (1,404) (3,357) (20,504)
    Net cash used in investing activities (360,197) (714,413) (447,792) (32,800) (320,041)
    FINANCING ACTIVITIES:
    Proceeds from follow-on offering, net of issuance costs 1,348,419 (360)
    Proceeds from issuance of preferred shares in joint venture 4,600
    Proceeds from issuance of common stock from employee stock options 7,408 5,678 8,147 4,759 13,649
    Proceeds from issuance of common stock from employee stock purchase plan 13,089 16,324
    Excess income tax benefit from stock-based compensation 10,188 16,008 15,982 18,639 13,114
    Other financing activities (2) (419) (7) 31 (1,899)
    Net cash provided by financing activities 1,366,013 38,596 24,122 39,753 24,864
    EFFECT OF EXCHANGE RATE CHANGES ON CASH AND CASH EQUIVALENTS 1,780 161 573 853 (4,304)
    CHANGE IN CASH AND CASH EQUIVALENTS 1,133,622 (593,203) (294,239) 136,242 (118,255)
    CASH AND CASH EQUIVALENTS—Beginning of period 262,670 1,396,292 803,089 508,850 645,092
    CASH AND CASH EQUIVALENTS—End of period  $ 1,396,292  $ 803,089  $ 508,850  $ 645,092  $ 526,837
    LINKEDIN CORPORATION
    TRENDED SUPPLEMENTAL REVENUE INFORMATION
    (In thousands)
    (Unaudited)
    Three Months Ended
    September 30,
    2013
    December 31,
    2013
    March 31,
    2014
    June 30,
    2014
    September 30,
    2014
    Revenue by product:
    Talent Solutions  $ 237,668  $ 261,359  $ 291,594  $ 322,227  $ 344,568
    Marketing Solutions 75,510 97,732 86,064 106,476 109,231
    Premium Subscriptions 79,782 88,128 95,535 105,174 114,466
    Total  $ 392,960  $ 447,219  $ 473,193  $ 533,877  $ 568,265
    Revenue by geographic region:
    United States  $ 245,302  $ 271,140  $ 284,878  $ 317,774  $ 343,132
    International
    Other Americas (1) 27,027 31,612 31,904 35,527 36,538
    EMEA (2) 90,087 108,309 117,871 134,930 139,702
    APAC (3) 30,544 36,158 38,540 45,646 48,893
    Total International revenue 147,658 176,079 188,315 216,103 225,133
    Total revenue  $ 392,960  $ 447,219  $ 473,193  $ 533,877  $ 568,265
    Revenue by geography, by product:
    United States
    Talent Solutions  $ 152,371  $ 164,207  $ 180,403  $ 197,852  $ 208,635
    Marketing Solutions 45,789 55,269 49,038 59,383 68,767
    Premium Subscriptions 47,142 51,664 55,437 60,539 65,730
    Total United States revenue  $ 245,302  $ 271,140  $ 284,878  $ 317,774  $ 343,132
    International
    Talent Solutions 85,297 97,152 111,191 124,375 135,933
    Marketing Solutions 29,721 42,463 37,026 47,093 40,464
    Premium Subscriptions 32,640 36,464 40,098 44,635 48,736
    Total International revenue  $ 147,658  $ 176,079  $ 188,315  $ 216,103  $ 225,133
    Total revenue  $ 392,960  $ 447,219  $ 473,193  $ 533,877  $ 568,265
    Revenue by channel:
    Field sales  $ 227,588  $ 270,672  $ 275,262  $ 318,984  $ 341,691
    Online sales 165,372 176,547 197,931 214,893 226,574
    Total  $ 392,960  $ 447,219  $ 473,193  $ 533,877  $ 568,265
    ______________
    (1) Canada, Latin America and South America
    (2) Europe, the Middle East and Africa (“EMEA”)
    (3) Asia-Pacific (“APAC”)
    LINKEDIN CORPORATION
    TRENDED RECONCILIATION OF GAAP TO NON-GAAP FINANCIAL MEASURES
    (In thousands, except per share data)
    (Unaudited)
    Three Months Ended
    September 30,
    2013
    December 31,
    2013
    March 31,
    2014
    June 30,
    2014
    September 30,
    2014
    Non-GAAP net income and net income per share:
    GAAP net income (loss) attributable to common stockholders  $ (3,363)  $ 3,782  $ (13,445)  $ (1,034)  $ (4,263)
    Add back: accretion of redeemable noncontrolling interest 126 100 101
    Add back: stock-based compensation 54,445 57,177 67,769 74,828 82,910
    Add back: amortization of intangible assets 3,832 4,056 4,813 7,224 9,986
    Income tax effects and adjustments (1) (8,120) (16,776) (11,914) (17,827) (22,661)
    NON-GAAP NET INCOME  $ 46,794  $ 48,239  $ 47,349  $ 63,291  $ 66,073
    GAAP diluted shares 113,940 124,438 120,967 122,170 123,427
    Add back: dilutive shares under the treasury stock method 5,248 3,884 3,087 3,046
    NON-GAAP DILUTED SHARES 119,188 124,438 124,851 125,257 126,473
    NON-GAAP DILUTED NET INCOME PER SHARE  $ 0.39  $ 0.39  $ 0.38  $ 0.51  $ 0.52
    Adjusted EBITDA:
    Net income (loss)  $ (3,363)  $ 3,782  $ (13,319)  $ (934)  $ (4,162)
    Provision for income taxes 8,155 9,477 13,581 16,253 12,917
    Other (income) expense, net (156) (1,820) (1,026) (1,197) (152)
    Depreciation and amortization 33,767 42,750 49,740 56,306 59,782
    Stock-based compensation 54,445 57,177 67,769 74,828 82,910
    ADJUSTED EBITDA  $ 92,848  $ 111,366  $ 116,745  $ 145,256  $ 151,295
    ______________
    (1) Excludes accretion of redeemable noncontrolling interest

     
    Image via LinkedIn

  • Here’s A Look At Which E-Commerce Categories Are Growing The Fastest

    Here’s A Look At Which E-Commerce Categories Are Growing The Fastest

    E-commerce is booming, and the coming holiday season will only fuel the fire. New research finds that consumer purchase intent is skyrocketing for many e-commerce categories.

    Do you expect your own online sales to increase significantly this year? Let us know in the comments.

    Nielsen says online purchase intention rates for over half of the twenty-two consumer product categories it measures have doubled between 2011 and 2014. The categories seeing the highest growth are ebooks, event tickets, computer software, sporting goods, toys and dolls, music, videos/DVDs/games, baby supplies, flowers, cars, alcoholic drinks, and pet-related products.

    Half of people surveyed, the firm says, plan on buying clothing or making an airline or hotel reservation using an online device within the next six months.

    Not as many people are buying groceries or other consumable products online, it says, but there there is growth in that area. Here’s a chart looking at the changes over the past three years category-by-category.

    “While durable and entertainment-based categories are showing a substantial rise in intent, consumable categories like pet supplies and baby supplies are also gaining traction quickly,” said John Burbank, President of Strategic Initiatives for Nielsen. “While online transactions make it easy to download a book, buy a ticket to a sporting event or book a hotel room, building a consumer base for consumable categories requires more marketing muscle. Finding the right balance between meeting shopper needs for assortment and value, while also building trust and overcoming negative perceptions, such as high costs and shipment fees, is vital for continued and sustainable growth.”

    “These shifts in stated purchase intentions are also supported by purchase data that indicates similar trends,” Nielsen says. “The baby supply category is really taking off in China, Korea, France, the U.S. and the U.K. to name a few countries. For example, sales of baby supplies already comprise three of the top 10 most popular categories sold online in China (based on Nielsen’s retail measurement e-commerce market figures). Meanwhile, in Korea, baby supplies make up two of the top 10 categories, and in France, they account for five. Online shopping accounts for a substantial portion of total diaper and infant formula sales in China (29% diapers/23% formula), Korea (10% diapers/22% formula [hypermarket online sales only]) and France (5% diapers/5% formula).”

    You can find the full report here.

    On the B2B side of things, Duke University’s Fuqua School of Business recently released data from its CMO survey (via Marketing Charts) finding that B2B CMOs in the U.S. expect e-commerce to account for roughly 10% of their sales to be through the internet in the next twelve months. That compares to roughly 15% for B2C CMOs.

    Are you in B2B or B2C? What percentage of your sales do you expect to come from the internet in the next twelve months? Let us know in the comments.

    Note: This article has been updated to include additional information.

    Image via Nielsen

  • Newegg Gives Same-Day Delivery A Try

    Newegg Gives Same-Day Delivery A Try

    Electronics e-tailer Newegg announced that it is testing a same-day delivery service starting in Los Angeles. With rival Amazon increasing its own same-day delivery coverage, it’s as good a time as any for Newegg to get the ball rolling.

    “Testing same-day delivery for our LA-based customers is something we’ve been excited about for many months,” said Soren Mills, Chief Marketing Officer of Newegg North America. “If all goes as planned, we will expand into new delivery areas.”

    Customers completing orders by 11:00 AM can select a “Local Express” delivery option for eligible products. They will then get their products before 6:00 PM.

    The company has a new fleet of delivery vehicles branded with “Newegg Express” to carry out the service.

    “For many customers, the ability to have a product delivered the day it’s ordered is important and, in some cases, it’s a determining factor when deciding where to buy,” Newegg said. “For this reason, same-day delivery is quickly becoming the gold standard of online retail. Newegg is piloting same-day delivery in the Los Angeles area to meet this evolving customer need.”

    Earlier this year, Newegg debuted an Amazon Prime-style “Peremier” club – a subscription service offfering expedited shipping, exclusive deals, etc. That costs customers $49.99 a year.

    In June, the company announced the launch of a new B2B marketplace called NeweggBusiness, serving as a third-party channel to connect B2B buyers and sellers, and focusing on product selection and competitive pricing.

    Earlier this month, Amazon announced the expansion of its own same-day deliver services into six more cities.

    Image via Newegg